Moneta Setup & Usage
Set up Moneta, choose a current process ID, and learn how to read and preserve its output. The screenshots show the recorded SUSA setup; installed versions, addresses, and process numbers may differ.
Accessing Moneta in SUSA
Moneta is a free, open source live memory analysis tool for Windows. It scans the memory of running processes and looks for indicators of compromise (IOCs) that are commonly associated with malware, process injection, shellcode, reflective DLL loading, process hollowing, and other fileless attack techniques.
Download Moneta from the GitHub repository.
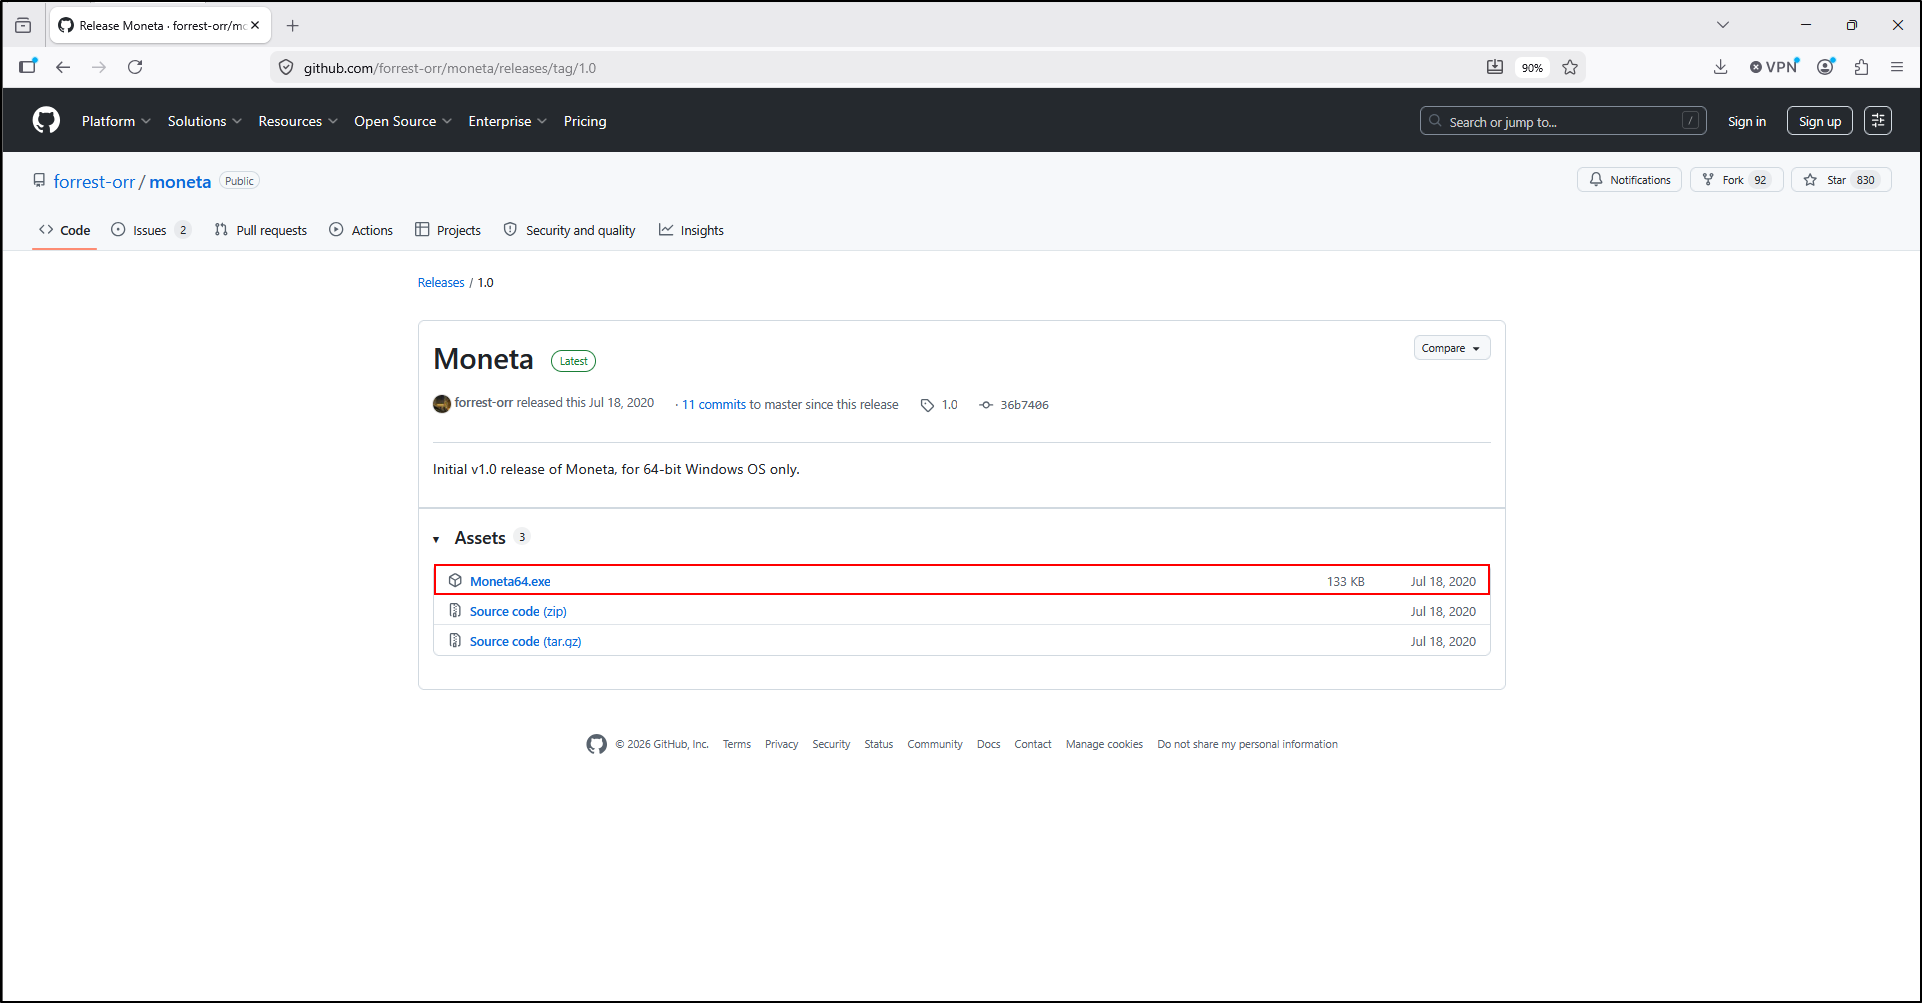
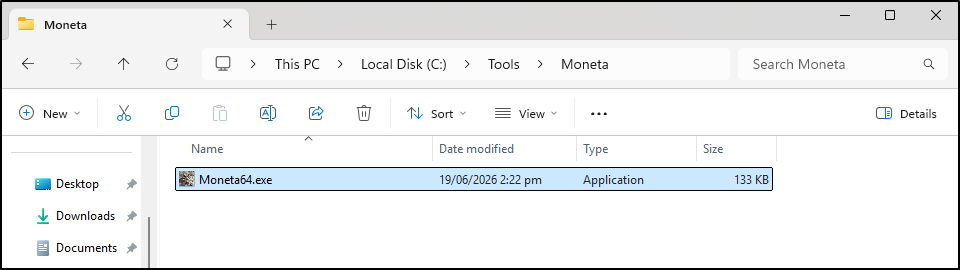
Move the executable to C:\Tools\Moneta.
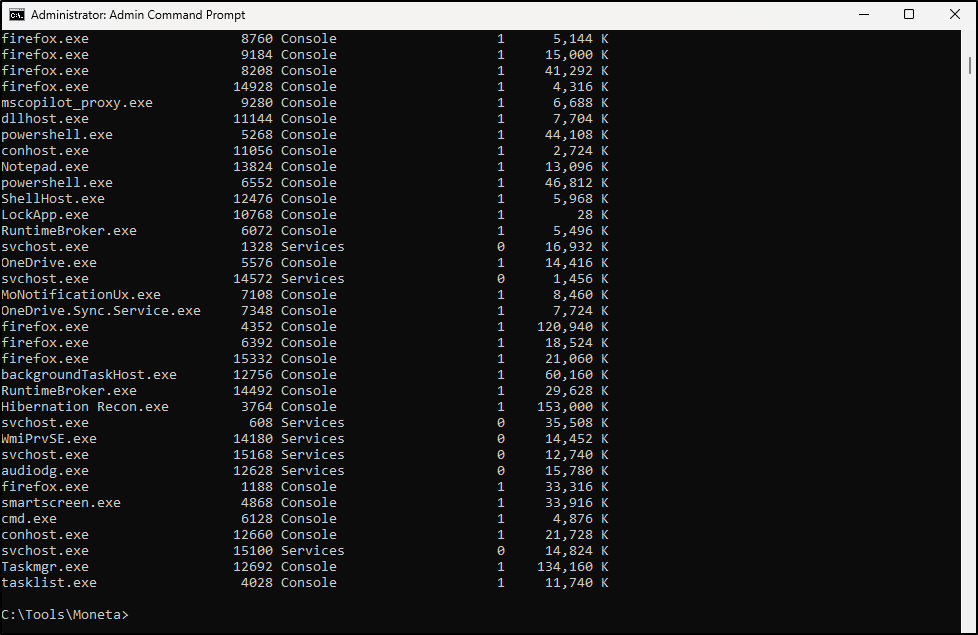
Open an administrator Command Prompt and navigate to C:\Tools\Moneta. List the running processes:
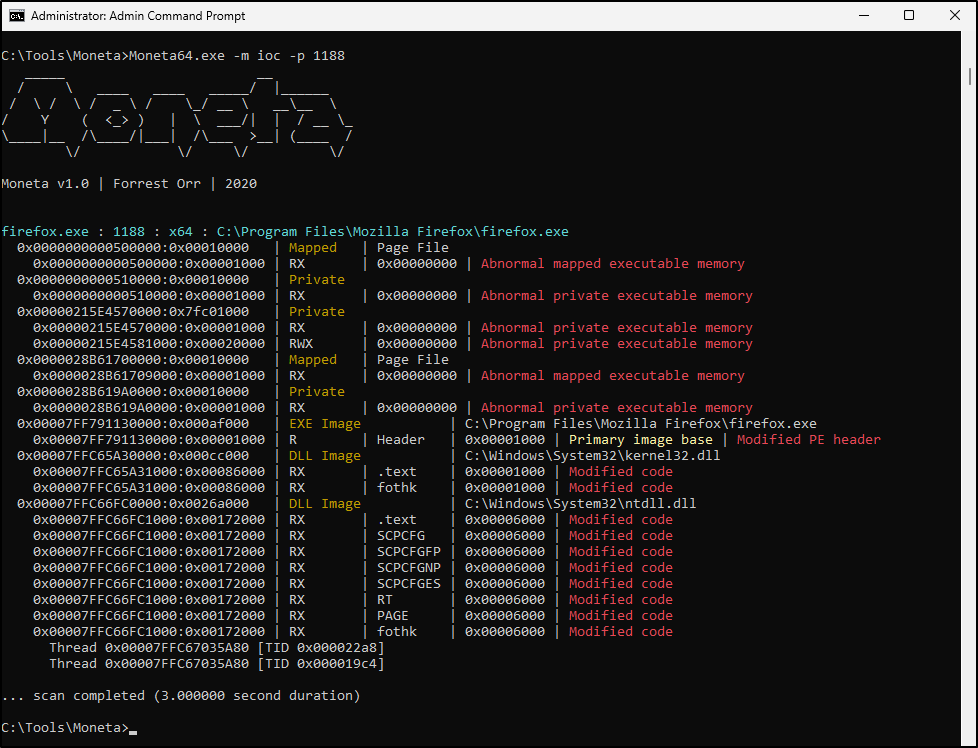
Replace the example process identifier with the current PID of the authorised process you want to inspect, then run:
Moneta findings require analyst validation, as legitimate software may generate false positives. Prioritise investigation of unbacked executable memory, private RWX regions, injected code, reflectively loaded DLLs, and suspicious memory artefacts in high risk processes.
Before the first scan: use a Windows SUSA workstation or disposable VM that you are allowed to inspect. Match the executable to the OS architecture; the examples use Moneta64.exe on 64-bit Windows. Keep your installed build's usage text and record the executable's SHA-256. The release link and four screenshots above preserve the recorded SUSA setup; check available releases when preparing your installation.
Use Moneta one step at a time
1. Read the local usage and choose a PID
In the administrator Command Prompt at C:\Tools\Moneta, run the executable without scan options to display its usage:
/FI filters the Windows process list by image name. Choose a current PID from your own result. If Firefox is absent, use a program you have opened for training. A browser may have several processes with the same name. The screenshot's PID 1188 is an example, not a permanent identity.
2. Start with a single-process IOC scan
Replace 1188 with your current PID. -m ioc selects memory regions that have associated suspicions. -p chooses the process. Let the scan finish and check the process header, completion message, and errors before interpreting the result. A scan can take longer on a large or busy process.
| In the output | Read it as | Keep this limit in mind |
|---|---|---|
| Process name, PID, and executable path | Which process Moneta reports examining | A familiar name does not establish trust. |
| Address and size | Where the selected memory lies and how large it is | Keep the values with the PID and time; they may change. |
| Private, Mapped, or Image | How the memory is associated with allocations or files | Private executable memory can also come from legitimate dynamic code. |
| R, W, X; RX or RWX | Read, write, and execute permissions | RWX means writable and executable; it does not identify who created the code. |
| A red suspicion label | Why Moneta selected the region | Colour is a triage cue, not a malware verdict. |
The Moneta usage reference describes scan selections and options. The author's explanation of false positives shows why browsers, runtimes, and other legitimate software can need extra interpretation.
3. Inspect one address before widening the scope
Use -v detail when you need more output. If you have a particular address from the scan, select its region:
Both the PID and address are examples. Replace them with values from the same live process. --option from-base includes the allocation associated with the selected address, and -v detail requests more detail. A fresh scan may differ because live allocations and processes change. Record that difference rather than silently treating two runs as the same capture.
What about scanning everything, filtering, or dumping memory?
-p * scans all accessible processes; it can produce far more output and access failures. Start with one PID while learning. Filters suppress selected classes of suspicions, so preserve an unfiltered result and record any filters you later apply. Confirm spellings in your installed build: the README's filter descriptions and examples are not completely consistent.
-d writes selected memory to disk. It is separate from saving a text report and can create sensitive binary material. The core labs use text output. For a later scoped dump, choose the exact process and region, record the generated filenames and hashes, and review the result with a suitable analysis tool rather than executing it.
4. Preserve the output and your reasoning
Create a new case folder with an outputs subfolder before redirecting output. This example keeps standard output and errors together:
Moneta64.exe -m ioc -p 1188 > "C:\Cases\Moneta-01\outputs\pid-1188-ioc.txt" 2>&1
type "C:\Cases\Moneta-01\outputs\pid-1188-ioc.txt"
> saves text to the named file, and 2>&1 sends errors to the same destination. Real Command Prompt can overwrite an existing file with >, so use a fresh name for each run. This command performs another live scan; it does not recover an earlier console result. type reopens the saved text so you can check it. Save the exact command, scan times, host, PID, path, and limitations alongside it.
If a scan does not go as expected
Moneta64.exe is not recognised
Use cd /d C:\Tools\Moneta in Command Prompt and check the executable's actual filename. A download may need extracting first. Keep the original download source and build details with your notes.
The process cannot be opened or its memory cannot be mapped
Check the PID again with tasklist, confirm the intended administrator window and architecture, and read the reported error. The process may have exited or be protected. Use your own harmless training process for the lab; do not change system protections to force a result. Record a failed scan as a failure, not a clean result.
The scan finishes but shows no IOC regions
Confirm the PID and any filters, and check for errors. Save the result as an observation at that time. No selected regions is different from proving that the process or host is clean.
There are many red findings, or a later scan differs
Start with one process and one region. Read the type, permissions, module context, and time together. Live memory changes, and legitimate runtimes or software instrumentation can explain some findings. Keep each run separately and write one next check, such as reviewing process-start events or comparing with a known baseline of the same application.
Practise the workflow
Use the Hands-on Labs for a guided Command Prompt case, then practise the same collection and reasoning habits with a harmless process in the Full Lab.