Volatility and Workbench Setup & Verification
Set up your chosen version, check that it runs, then continue to the Hands-on Labs. The screenshots show the recorded SUSA setup; installed versions, prompts and paths may differ.
Volatility and Workbench V2
Volatility 2 is the older version but still widely used due to its large number of plugins and extensive community examples.
Download Volatility Workbench V2.1.
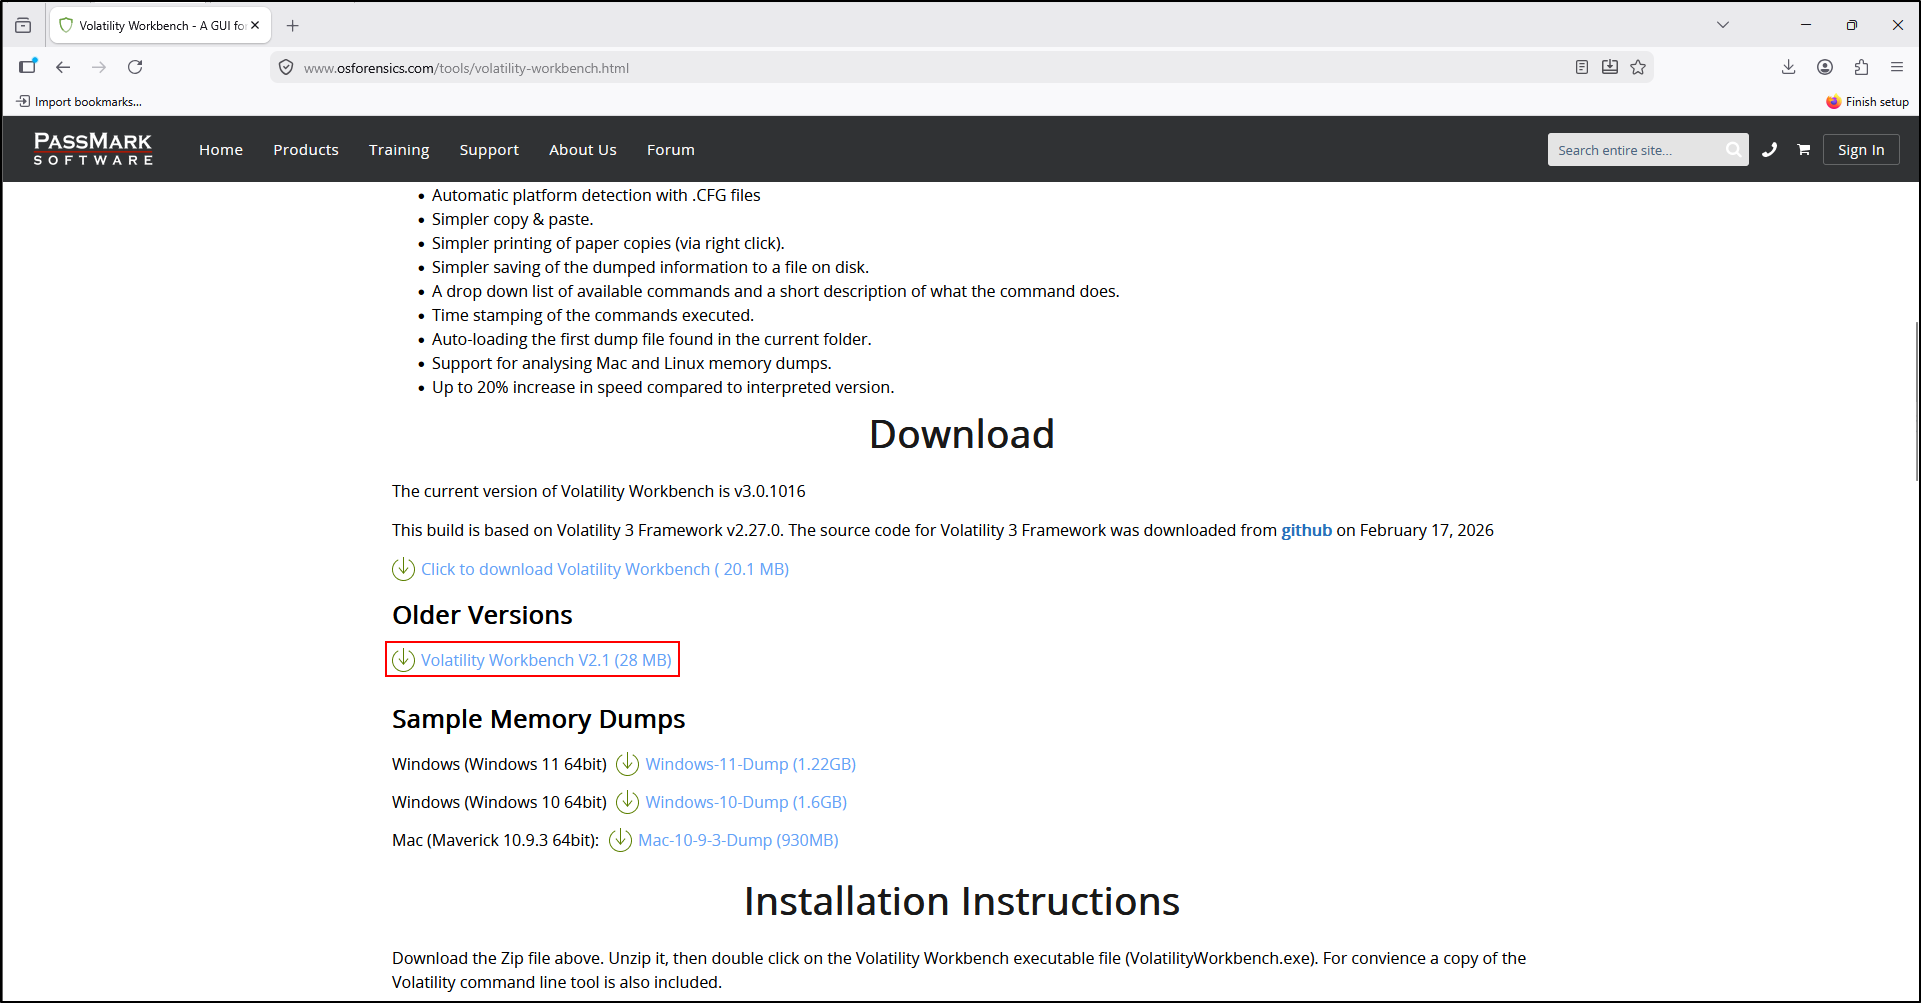
Extract the downloaded ZIP archive to C:\Tools\VolatilityWorkbench-v2.1. This should contain Volatility 2 standalone executable and Volatility Workbench V2.1.
Testing Volatility 2
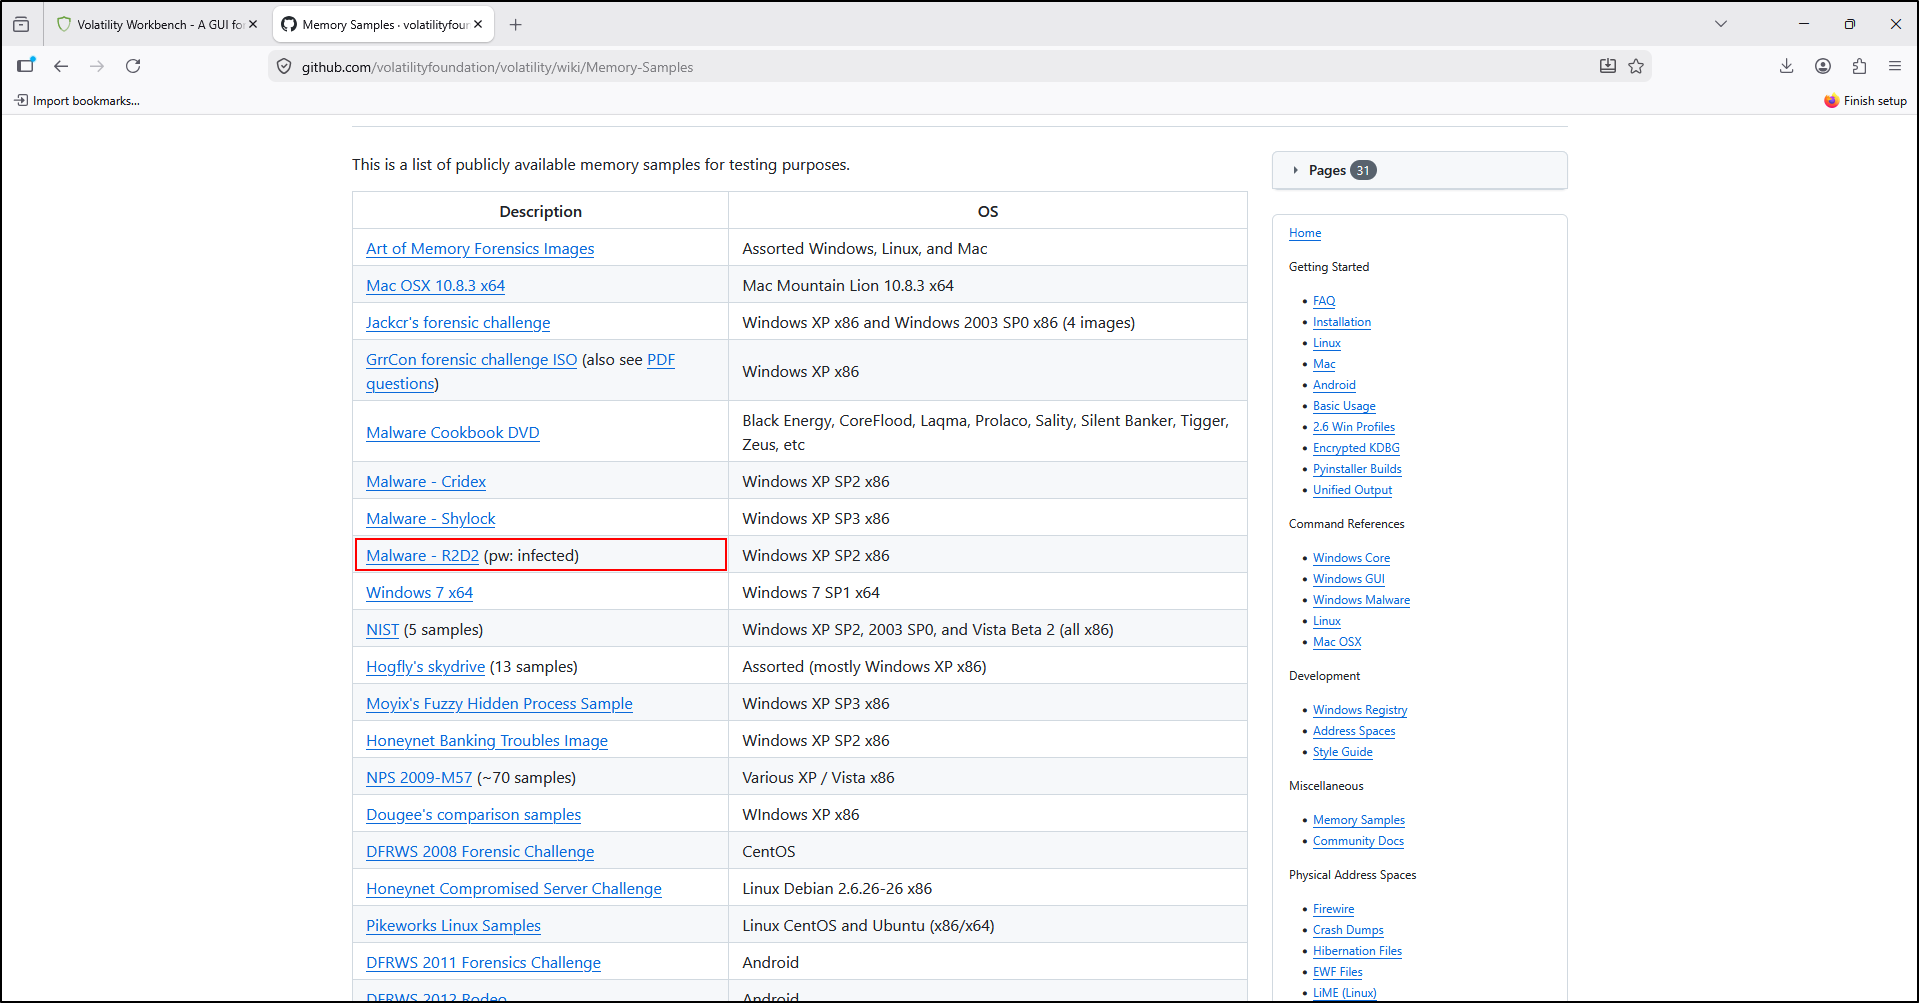
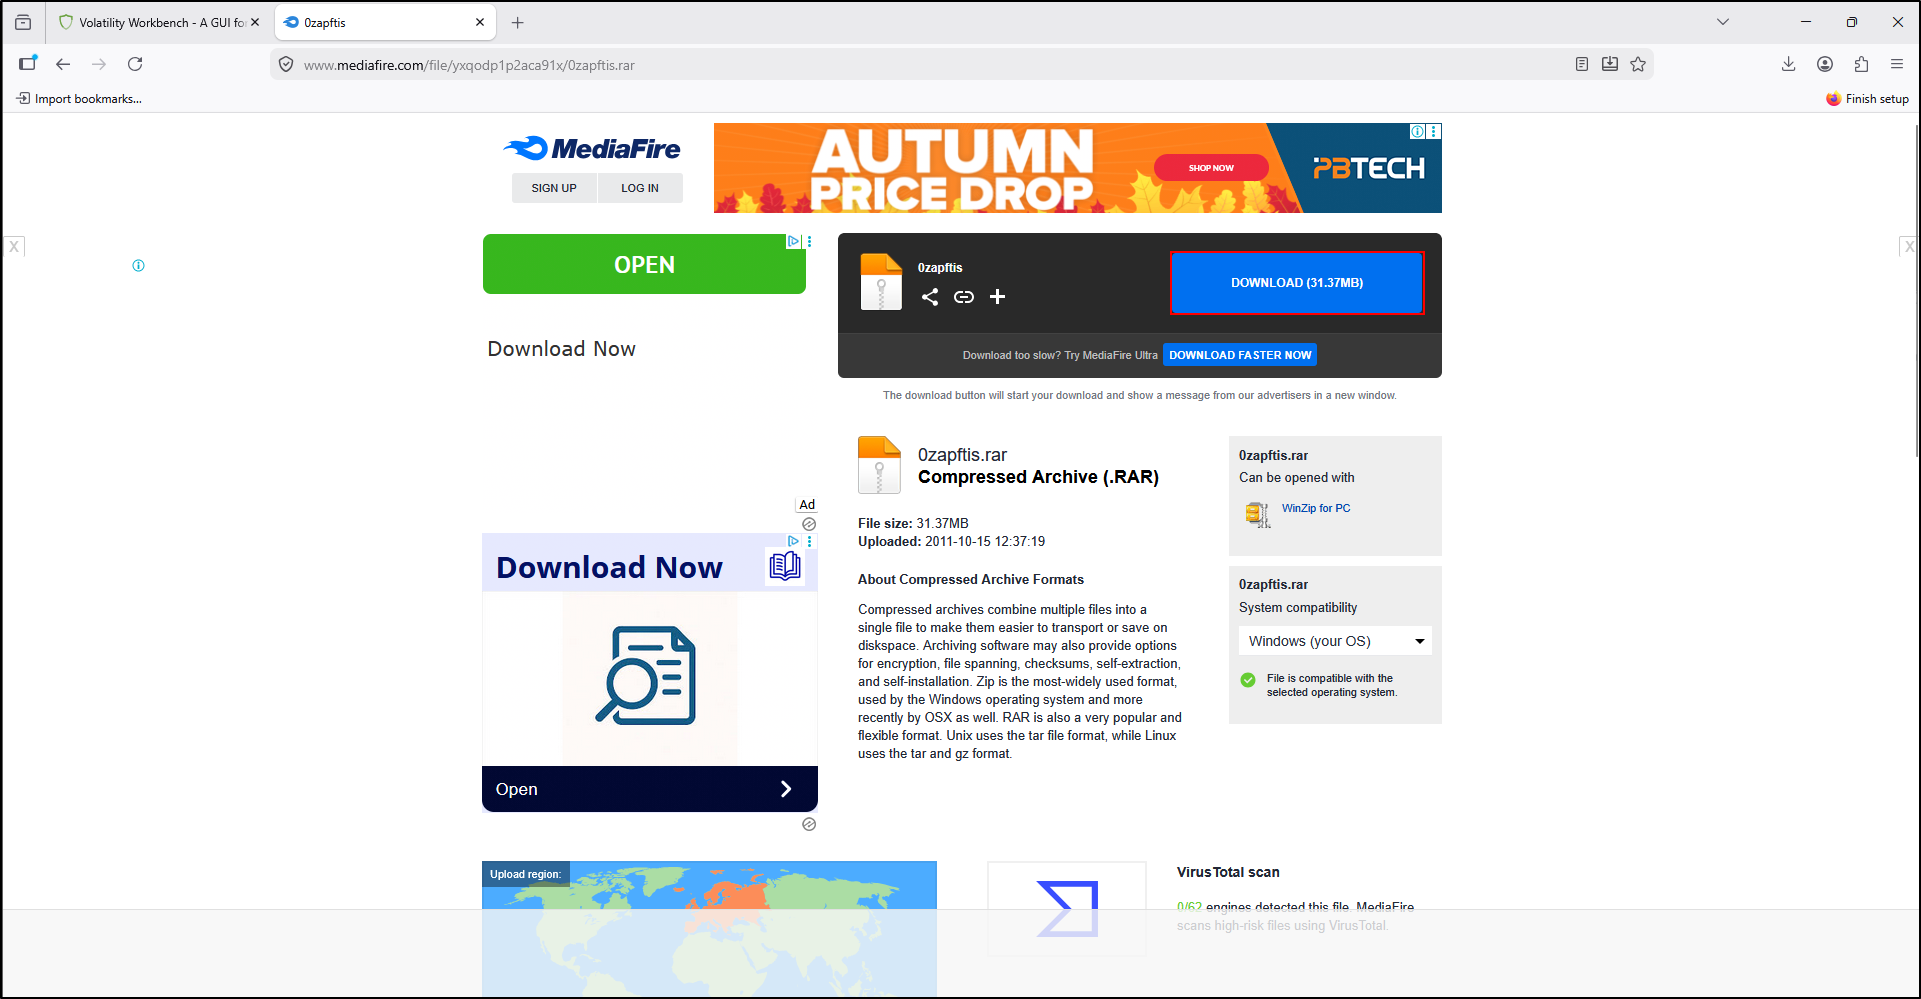
Download the memory sample (Malware: R2D2).
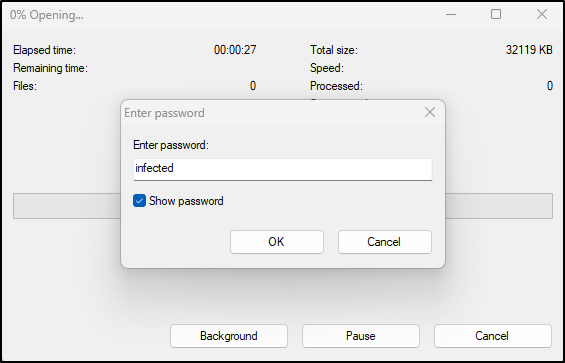
Open the archive with 7-zip. Enter infected as the password and click OK.
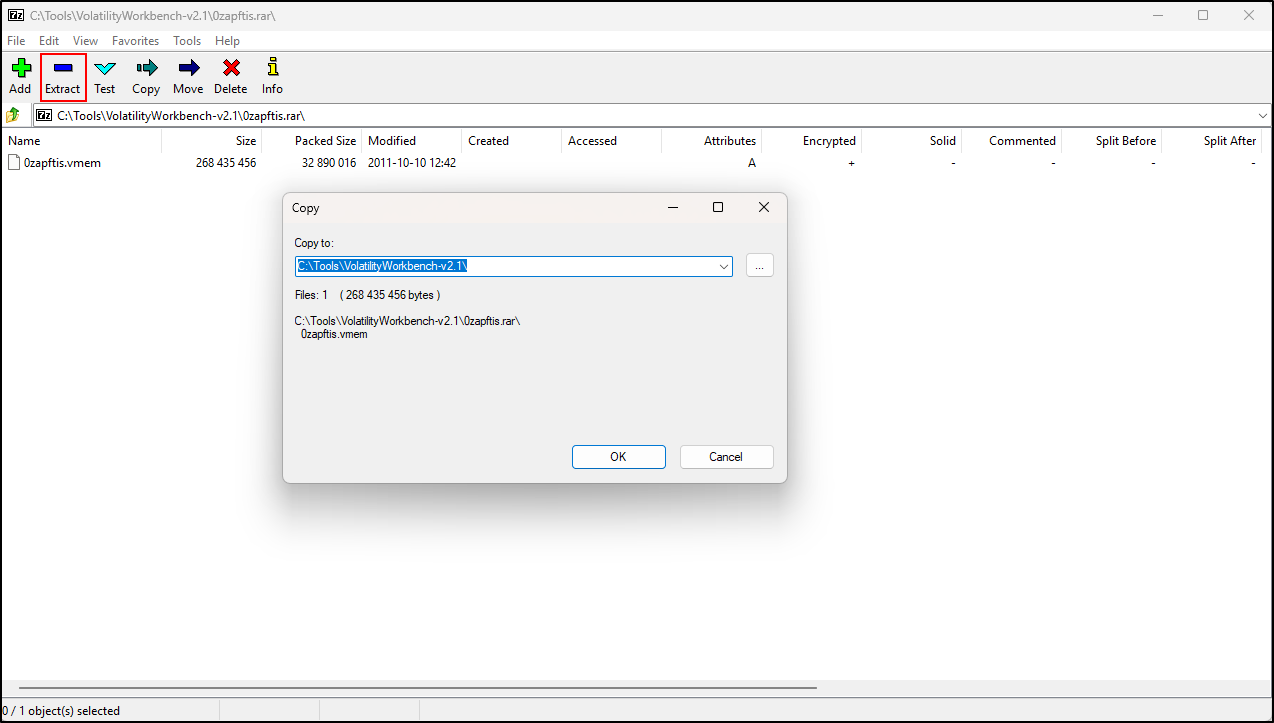
Click Extract then select OK.
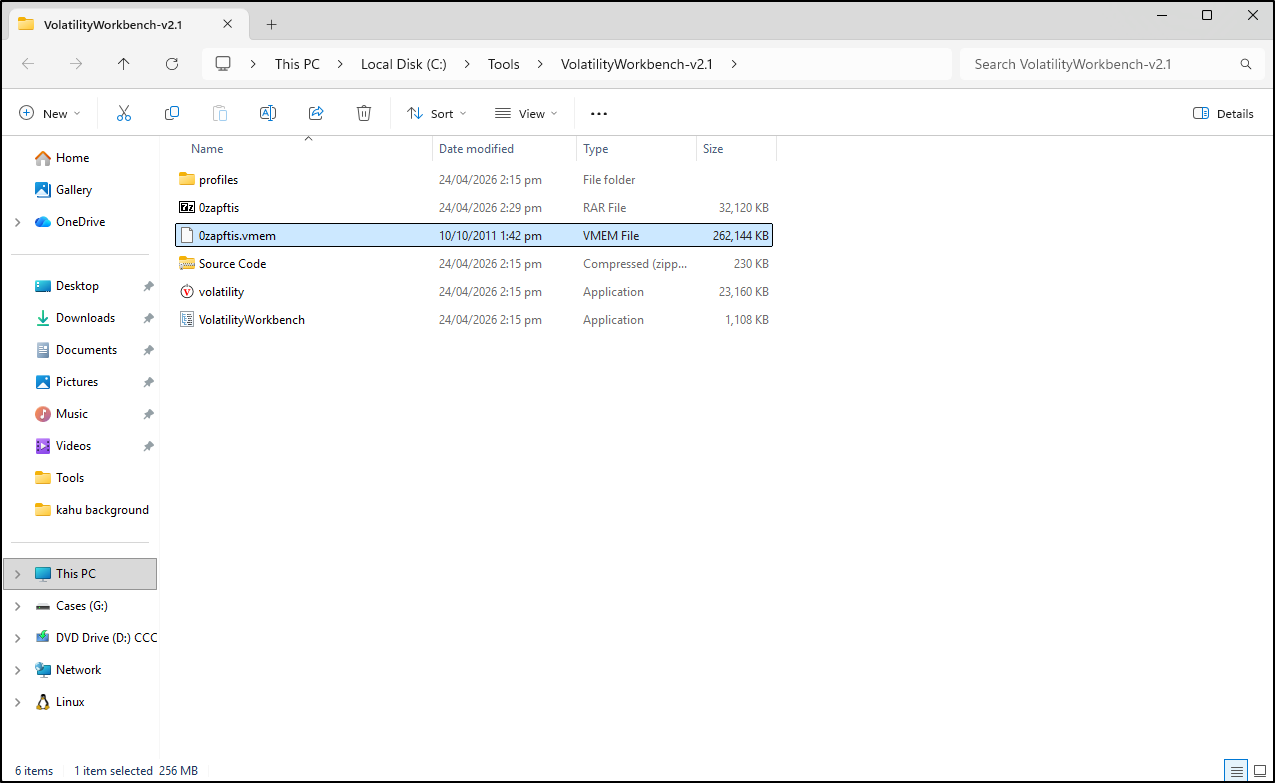
You should now see the memory sample (0zapftis.vmem).
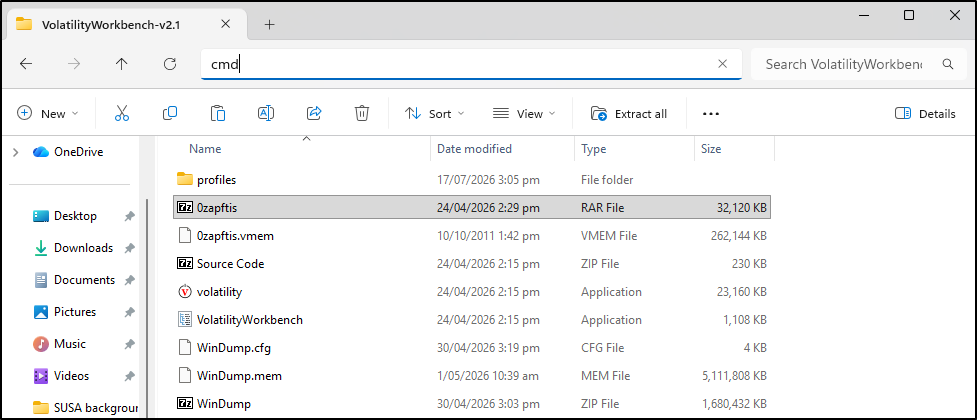
In the File Explorer address bar, type cmd. This will open a command prompt in the C:\Tools\VolatilityWorkbench-v2.1 directory.
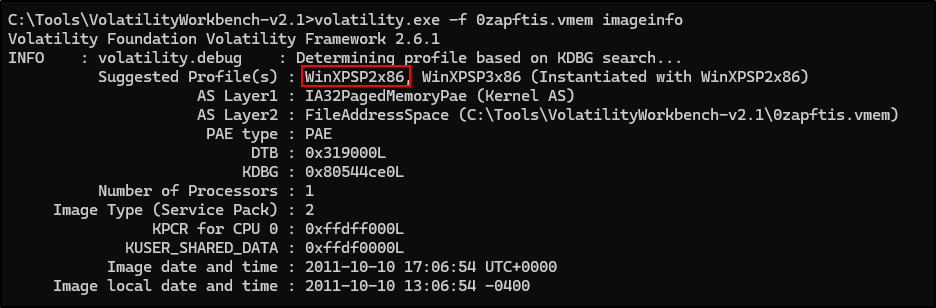
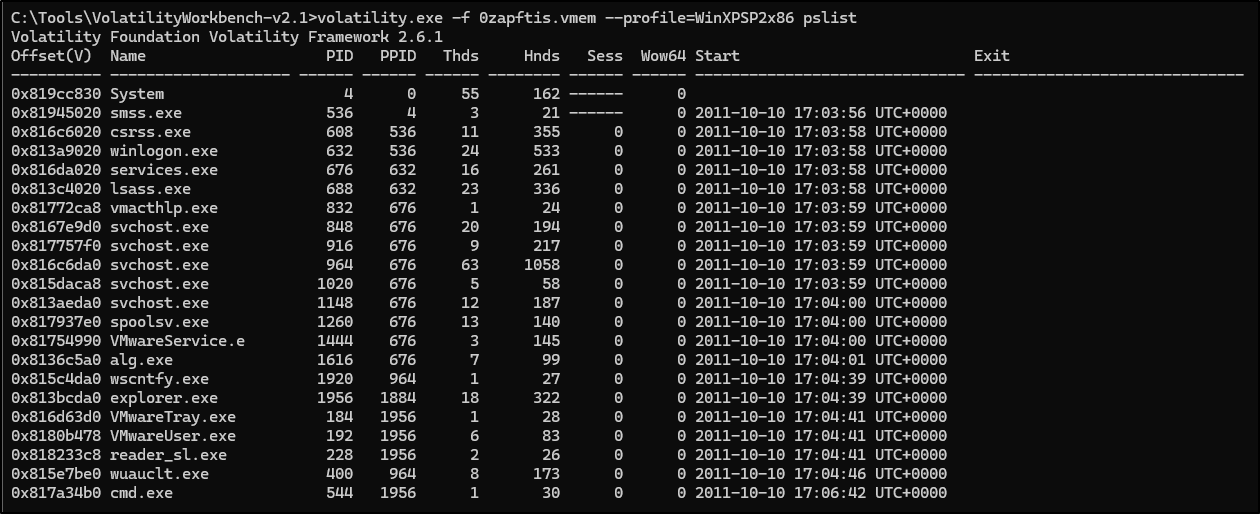
Run Volatility 2 to determine the profile of the memory sample. The results show that profile is most likely WinXPSP2x86.
Run Volatility 2 with the profile tag determine process list of the memory sample.
Testing Volatility Workbench v2.1
Download another memory sample (Windows 10 64bit).
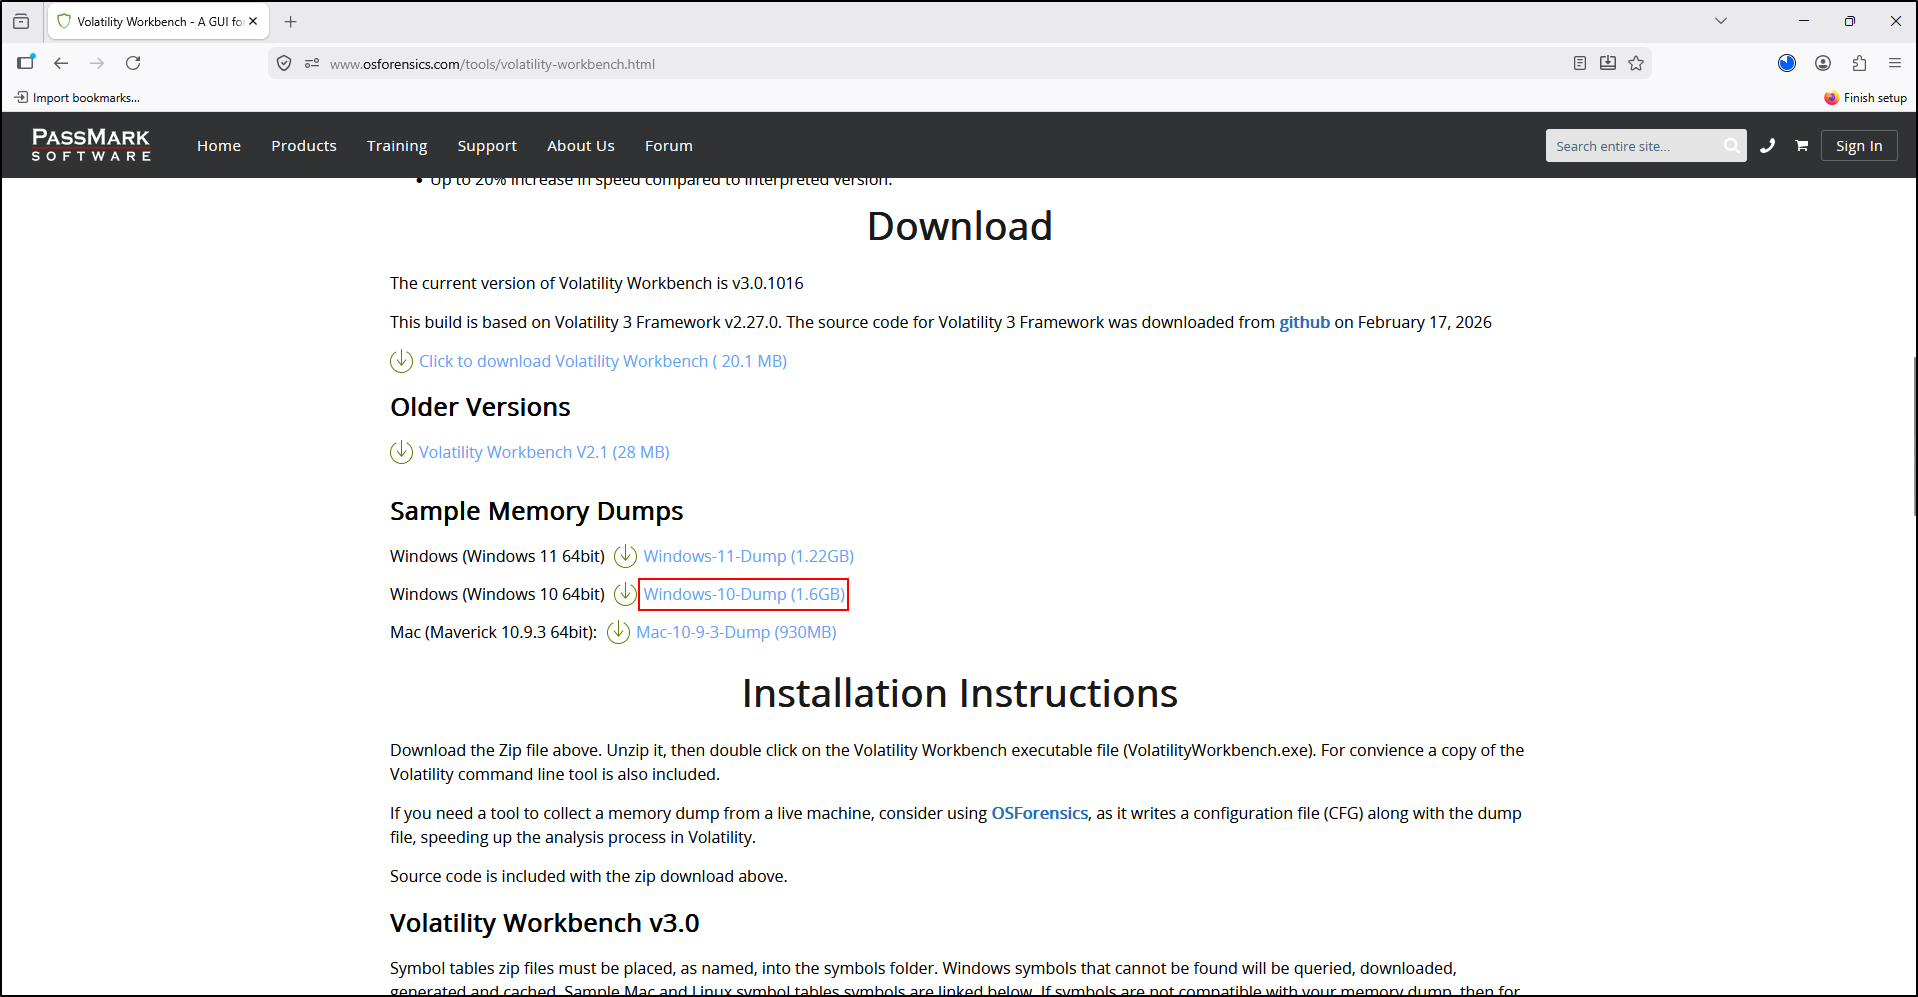
Extract the downloaded ZIP file to C:\Tools\VolatilityWorkbench-v2.1. This will extract WinDump.mem in that directory.
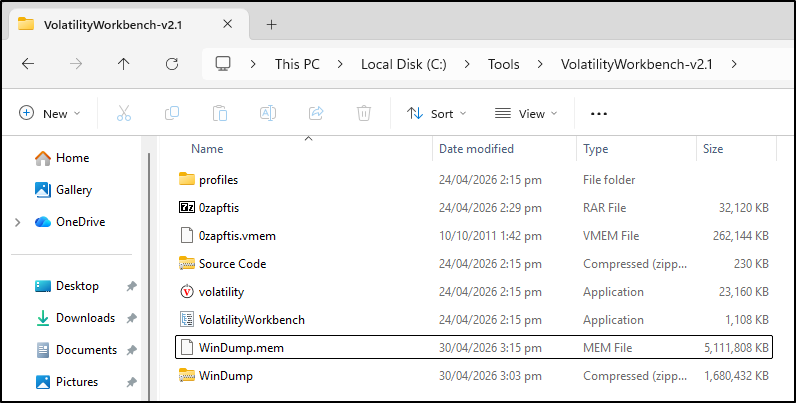
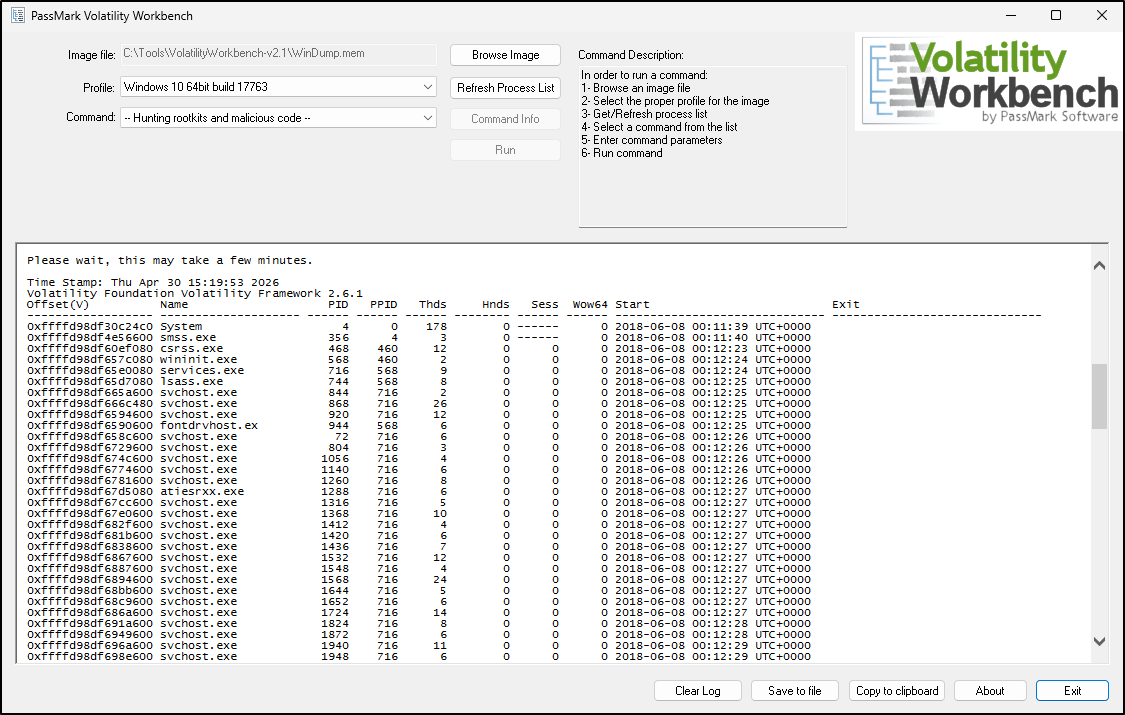
Double click VolatilityWorkbench. Click Browse Image and select WinDump.mem. For Profile, select Windows 10 64bit build 17763 and click Get Process List. This process may take some time.
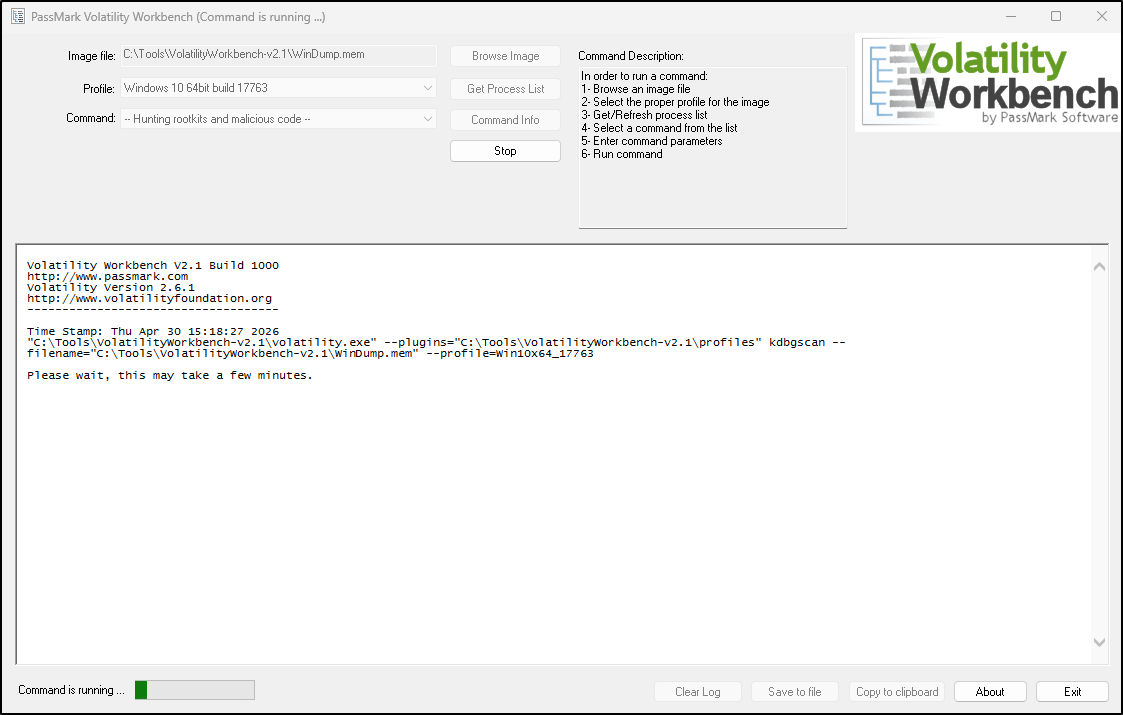
After few minutes, we can see a list of processes from the WinDump.mem.
Workbench 3 / download and symbols
Volatility and Workbench V3
Volatility 3 is the newer version and is actively developed. It removes the need for profiles and provides more reliable and consistent parsing, especially for modern operating systems.
Download Volatility Workbench V3.
Extract the downloaded ZIP archive to C:\Tools\VolatilityWorkbench-v3.0. This should contain Volatility 3 standalone executable and Volatility Workbench V3.0.
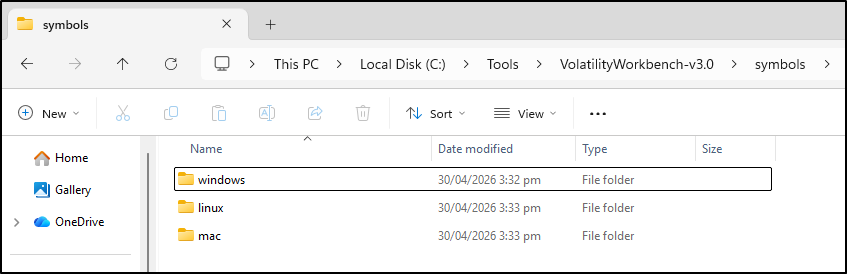
Symbol tables ZIP files must be placed, as named, into the symbols folder. Windows symbols that cannot be found will be queried, downloaded, generated and cached. Sample Mac and Linux symbol tables symbols are linked below.
Download the symbol table packs you need and place the ZIP files, as named, in C:\Tools\VolatilityWorkbench-v3.0\symbols. Keep them as ZIP files, following the Workbench symbol instructions.
Windows:https://downloads.volatilityfoundation.org/volatility3/symbols/windows.zip
Mac:https://downloads.volatilityfoundation.org/volatility3/symbols/mac.zip
Linux:https://downloads.volatilityfoundation.org/volatility3/symbols/linux.zip
Optional route / separate framework installation
Installing Volatility 3 with Python
The recorded setup compares the framework bundled with Workbench (2.26.2) with a separate Volatility 3 installation. Version numbers in the walkthrough and screenshots describe those recorded examples; check the release you install rather than treating these numbers as the current release.
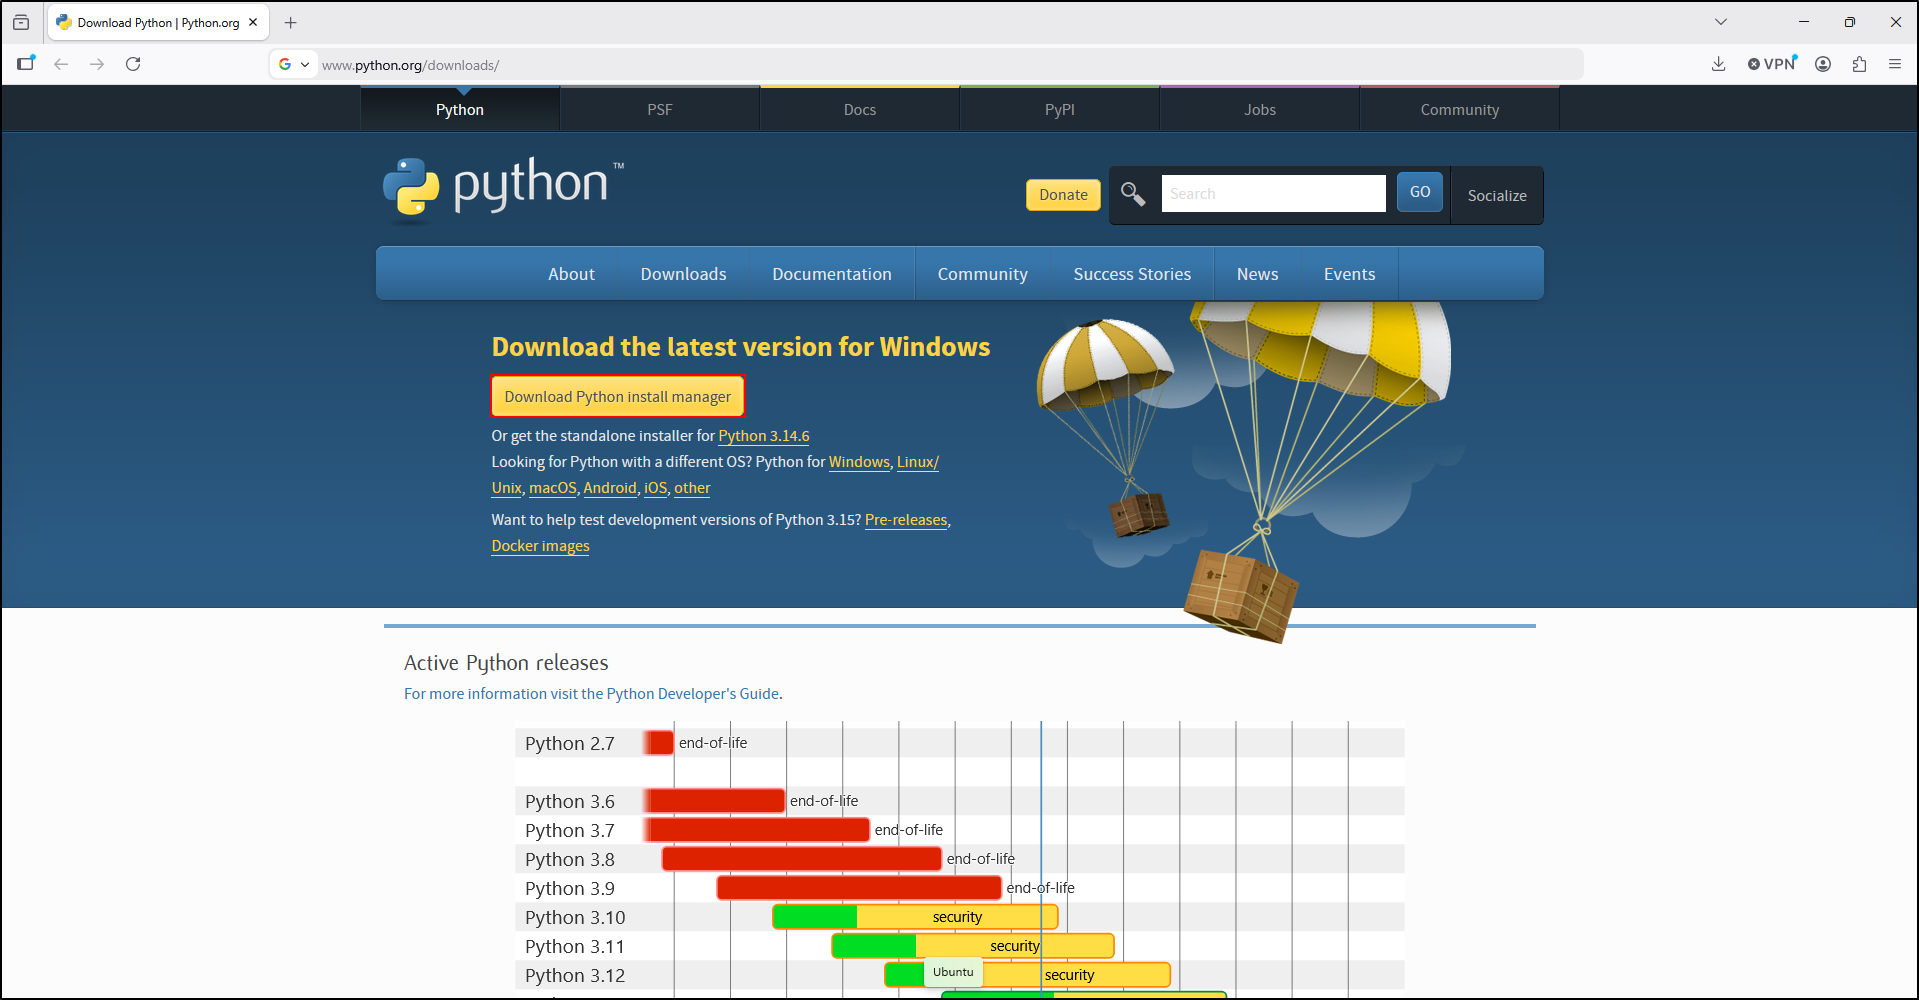
To install latest Volatility 3, first download Python install manager.
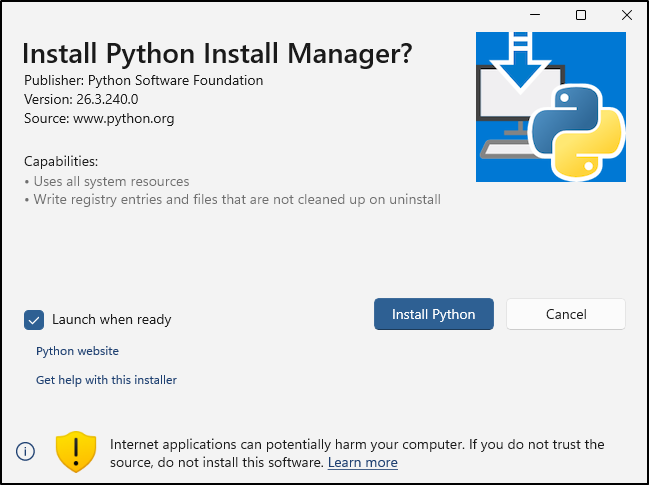
Double click the installer file and click Install Python.
When asked to Update setting now, type y and press enter.
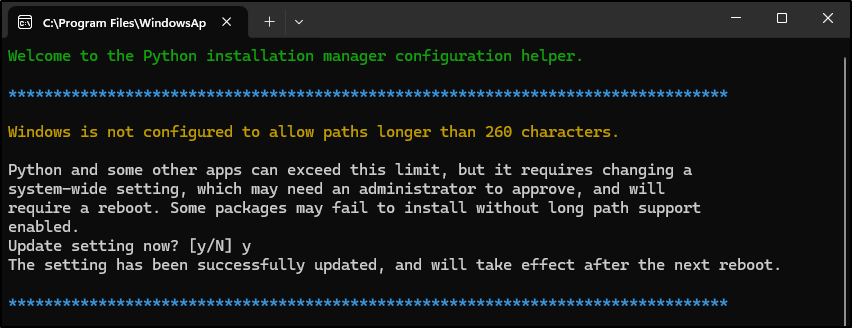
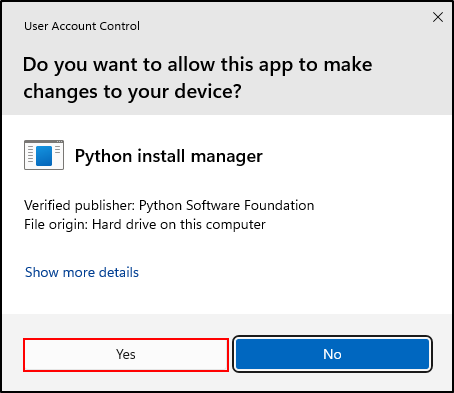
Click Yes to allow Python install manager to make changes.
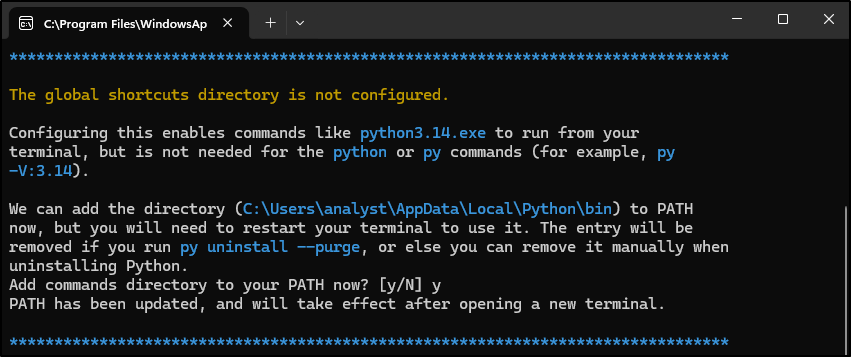
When asked to Add commands directory to your PATH now, type y and press enter.
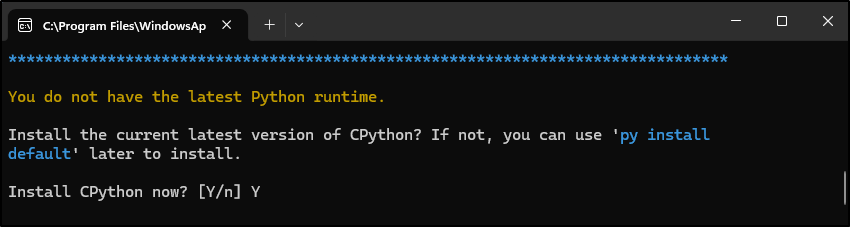
If prompted to install CPython, type Y and press enter.
After installation is complete, close terminal.
Open command prompt and install Volatility 3 by running:
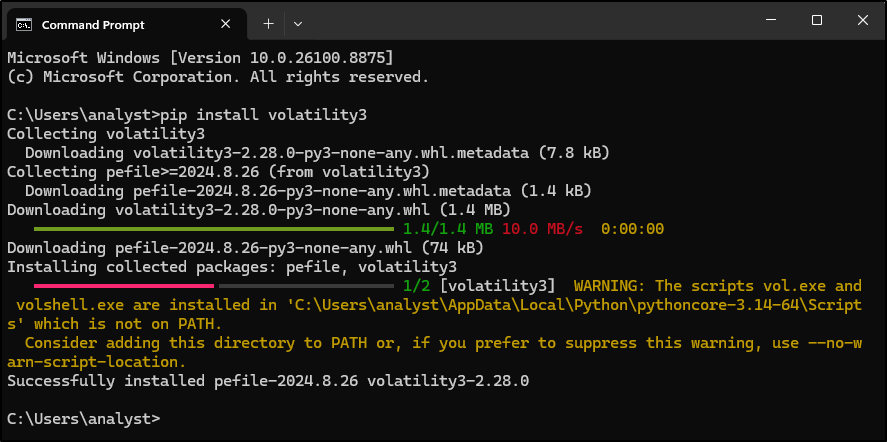
Alternatively, download the Volatility 3 wheel file.
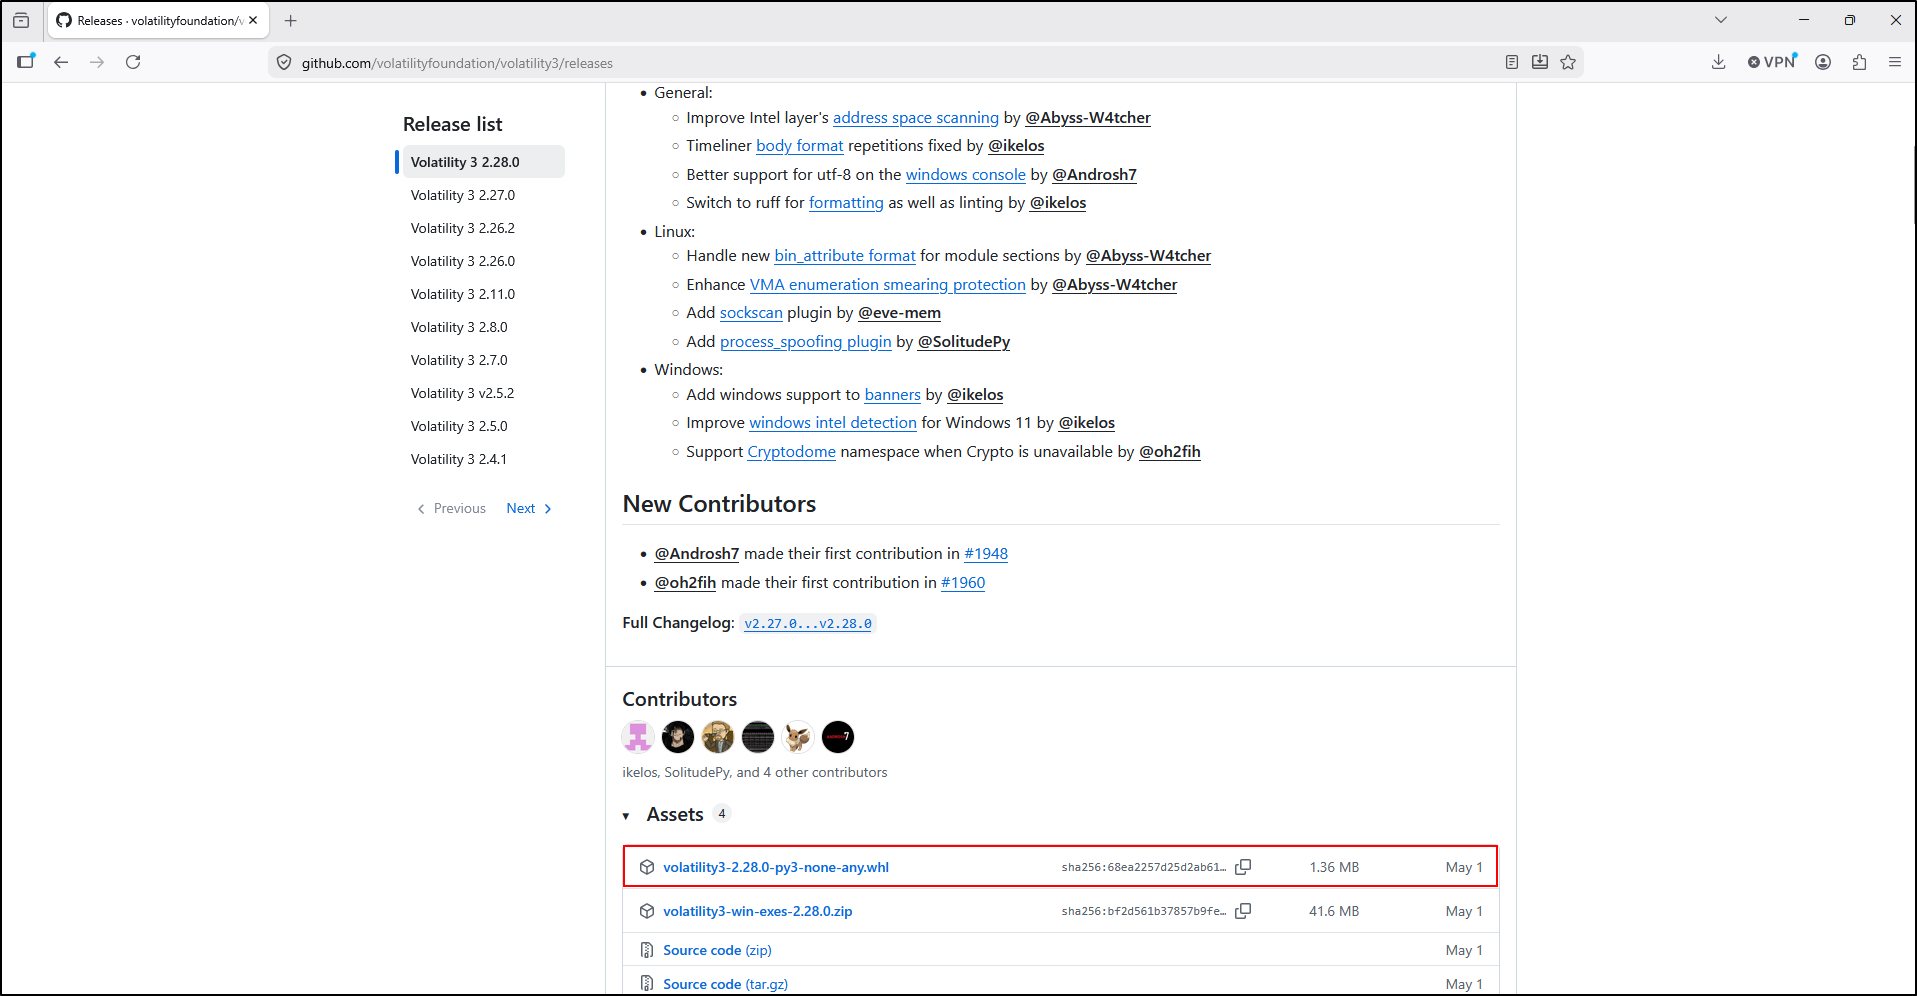
Move the wheel file to C:\Tools\Volatility3. Open the command prompt as an administrator and navigate to the C:\Tools\Volatility3 directory. Run the following command to install Volatility 3:
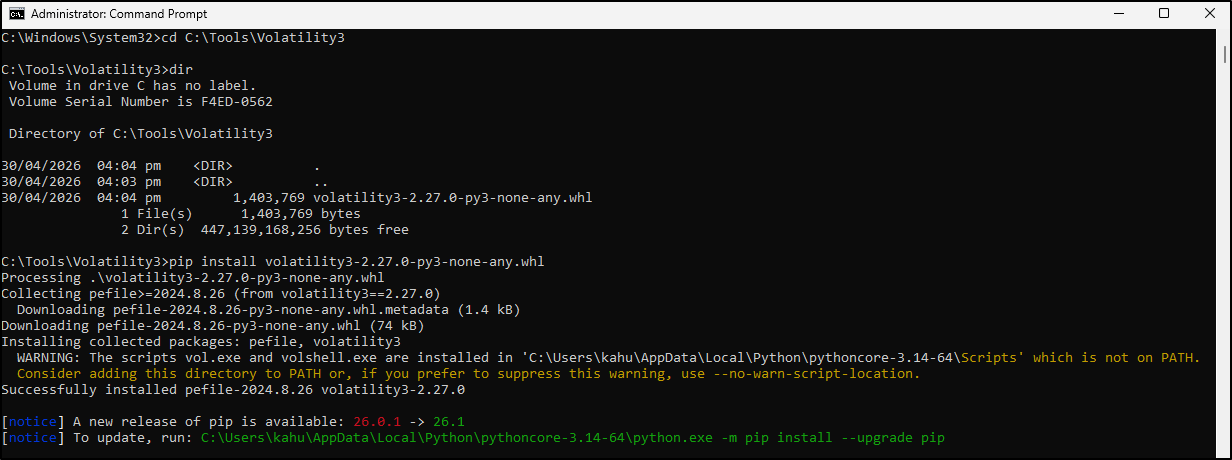
Verify that volatility is working by running the follow command in command prompt.
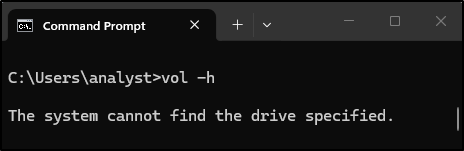
If you get the error message saying the system cannot find the drive specified, this is because vol is also a built in Windows CMD command for showing a disk volume label.
Open an administrator Command Prompt and create a vol3.bat file:
When prompted to create a new file, click Yes.
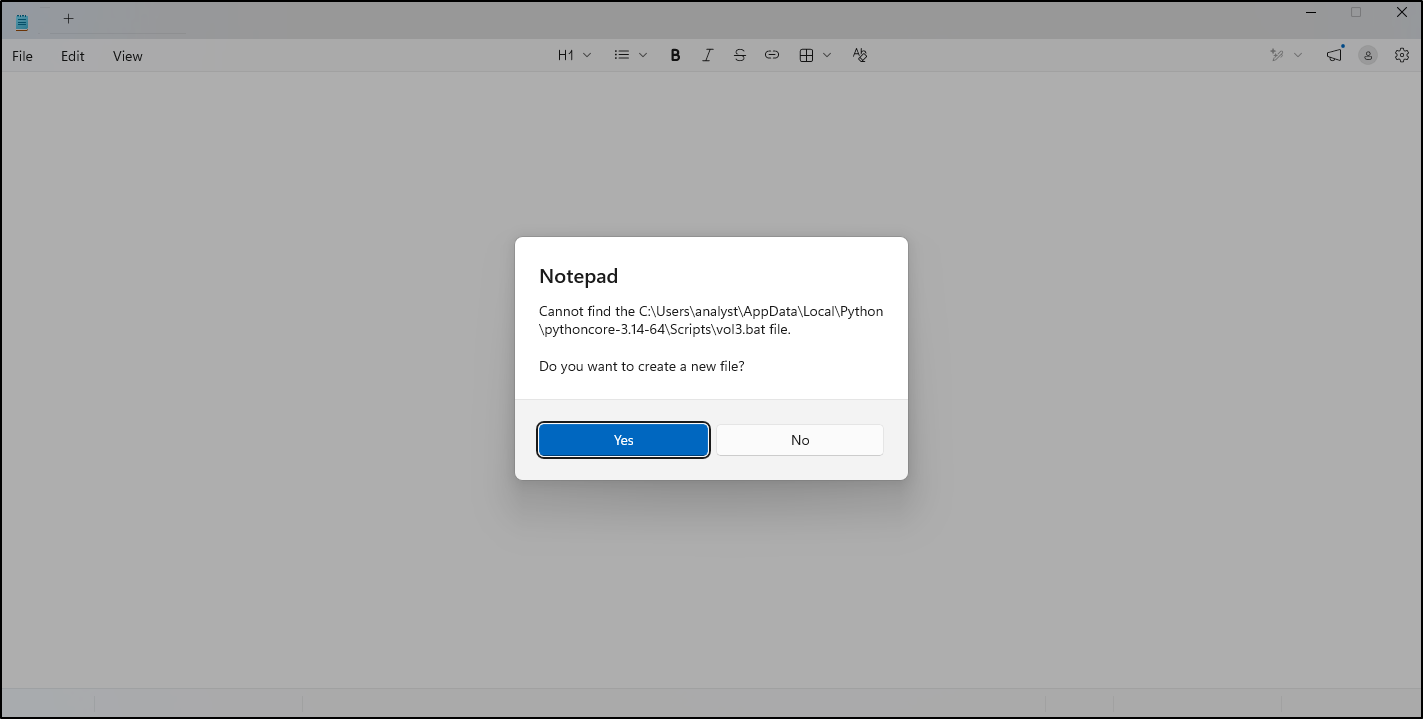
Paste the following content the save it.
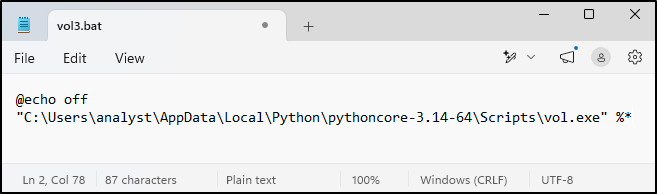
Adding Scripts to PATH environment variable
Open Environment Variables (Start › Environment Variables › Edit the system environment variables › Environment Variables).
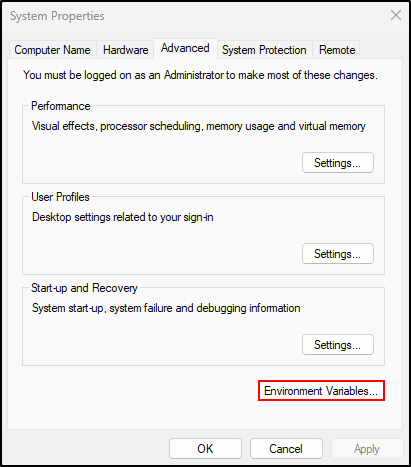
Under User variables, select path and click Edit.
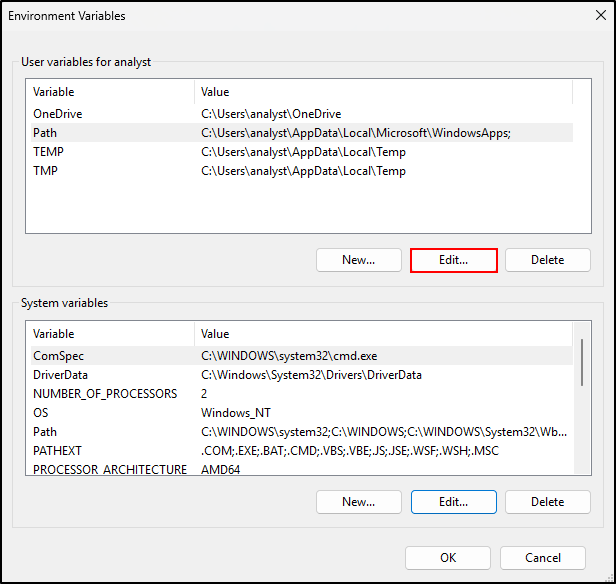
Click New and add (one entry per line):
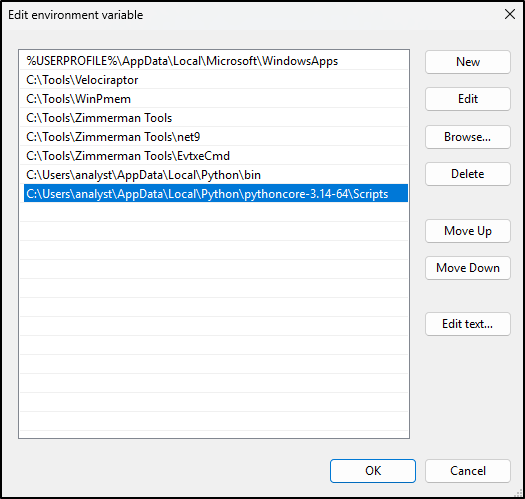
Click OK on every window. Close and reopen Command Prompt.
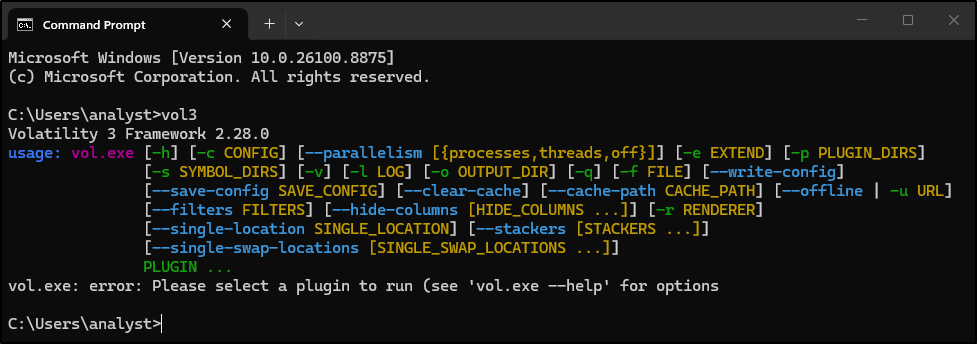
In Command Prompt, run vol3 and verify that it is Volatility 3 Framework.
Testing Volatility 3 (2.26.2)
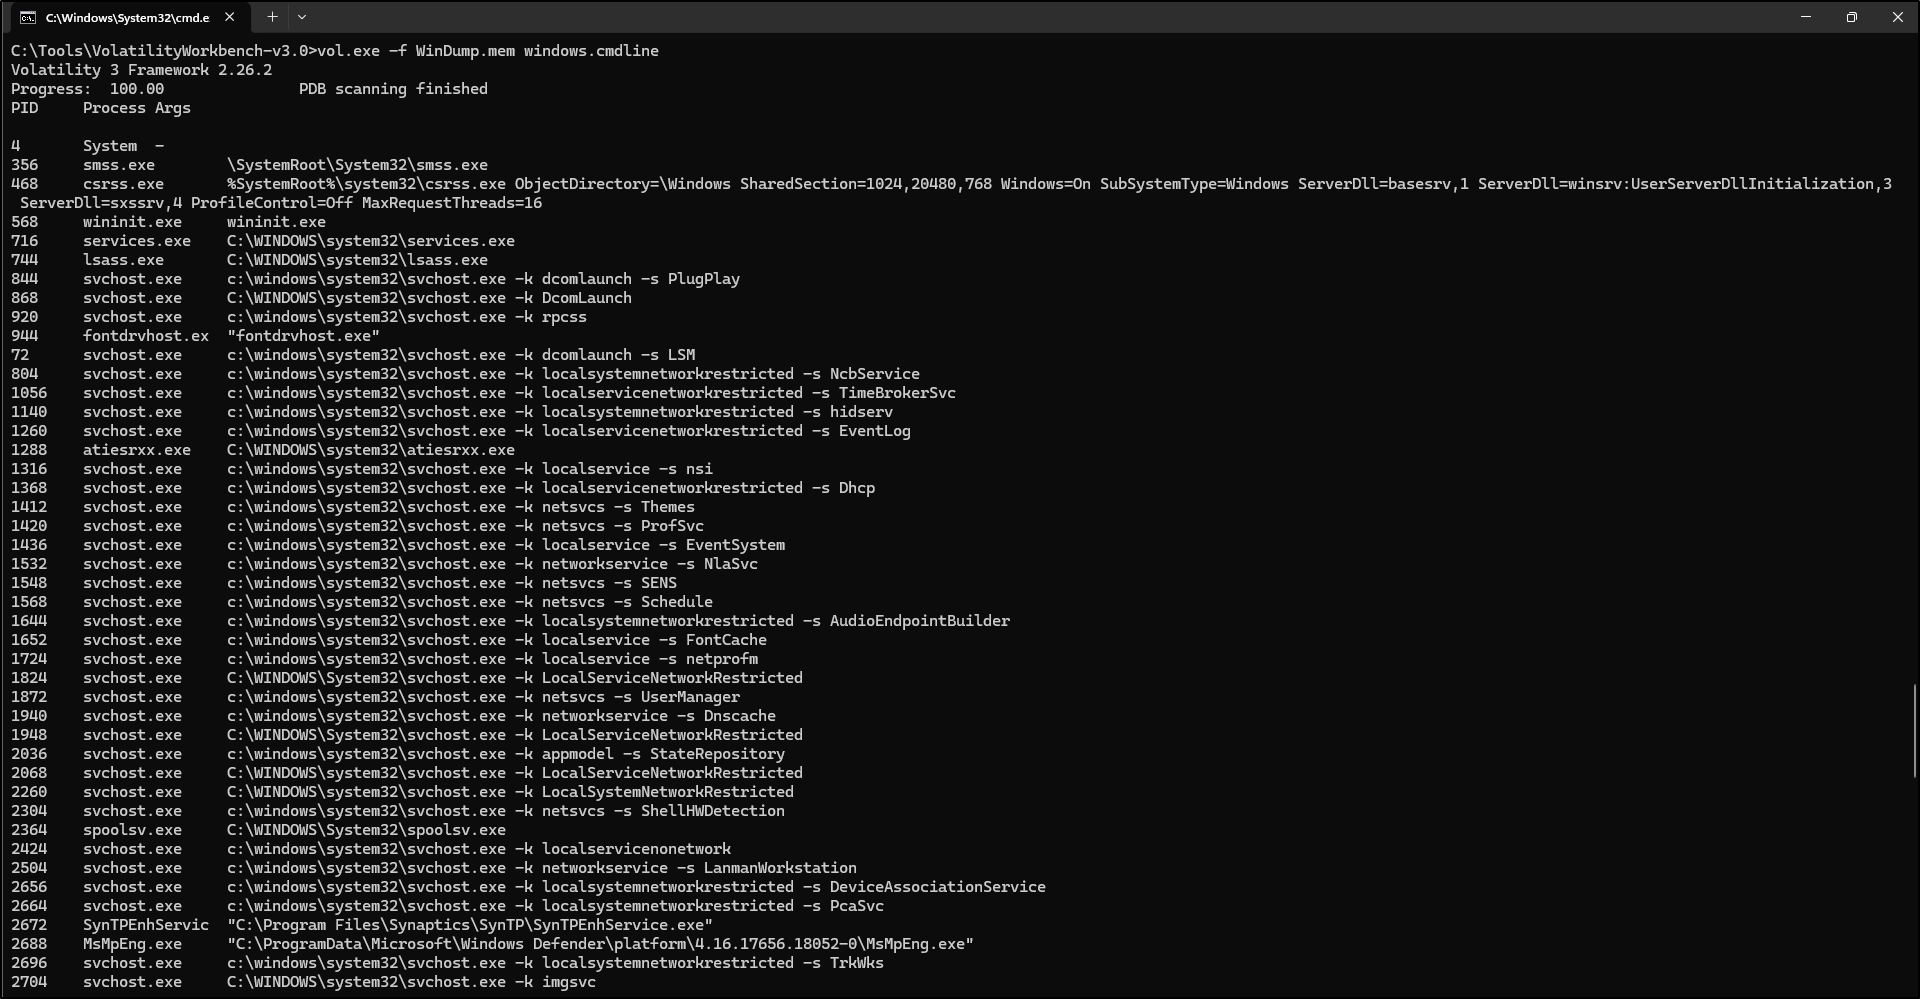
Copy the WinDump.mem that was downloaded earlier to C:\Tools\VolatilityWorkbench-v3.0.
Open a command prompt and navigate to C:\Tools\VolatilityWorkbench-v3.0.
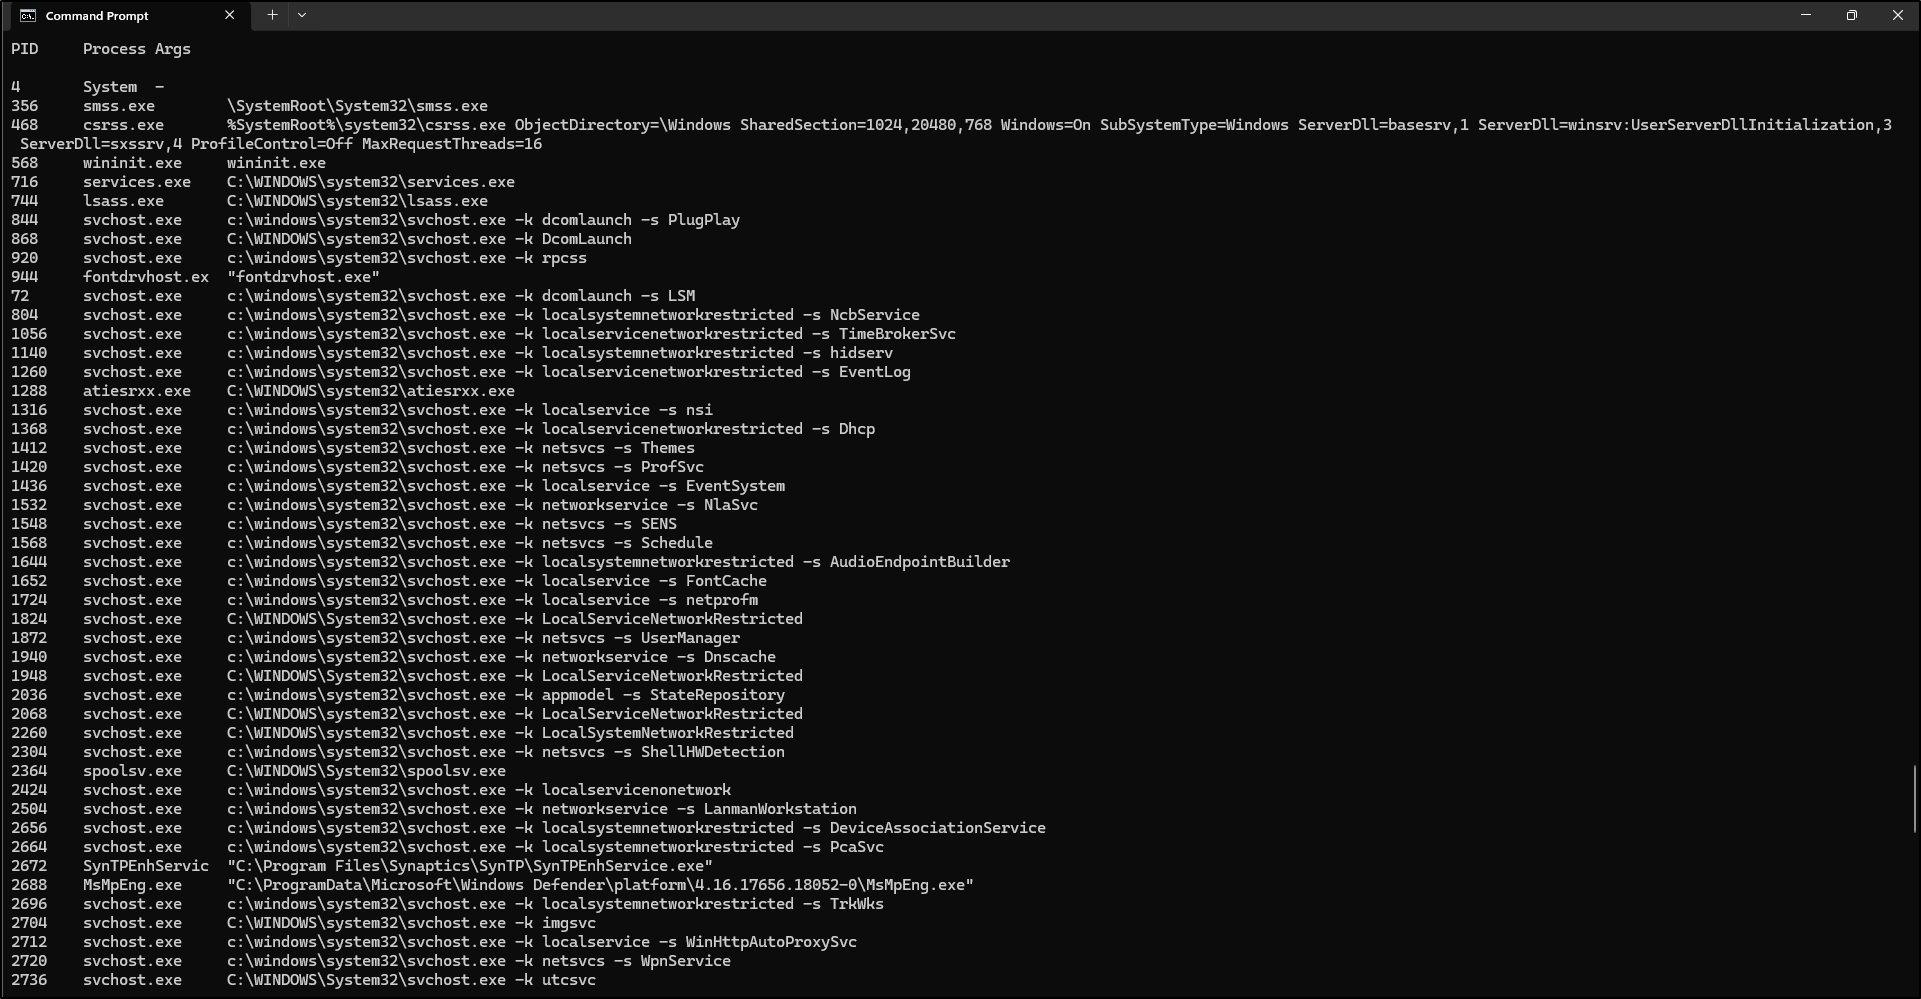
Run the following command to view a command line from the memory dump:
Testing Volatility 3 (2.27.0)
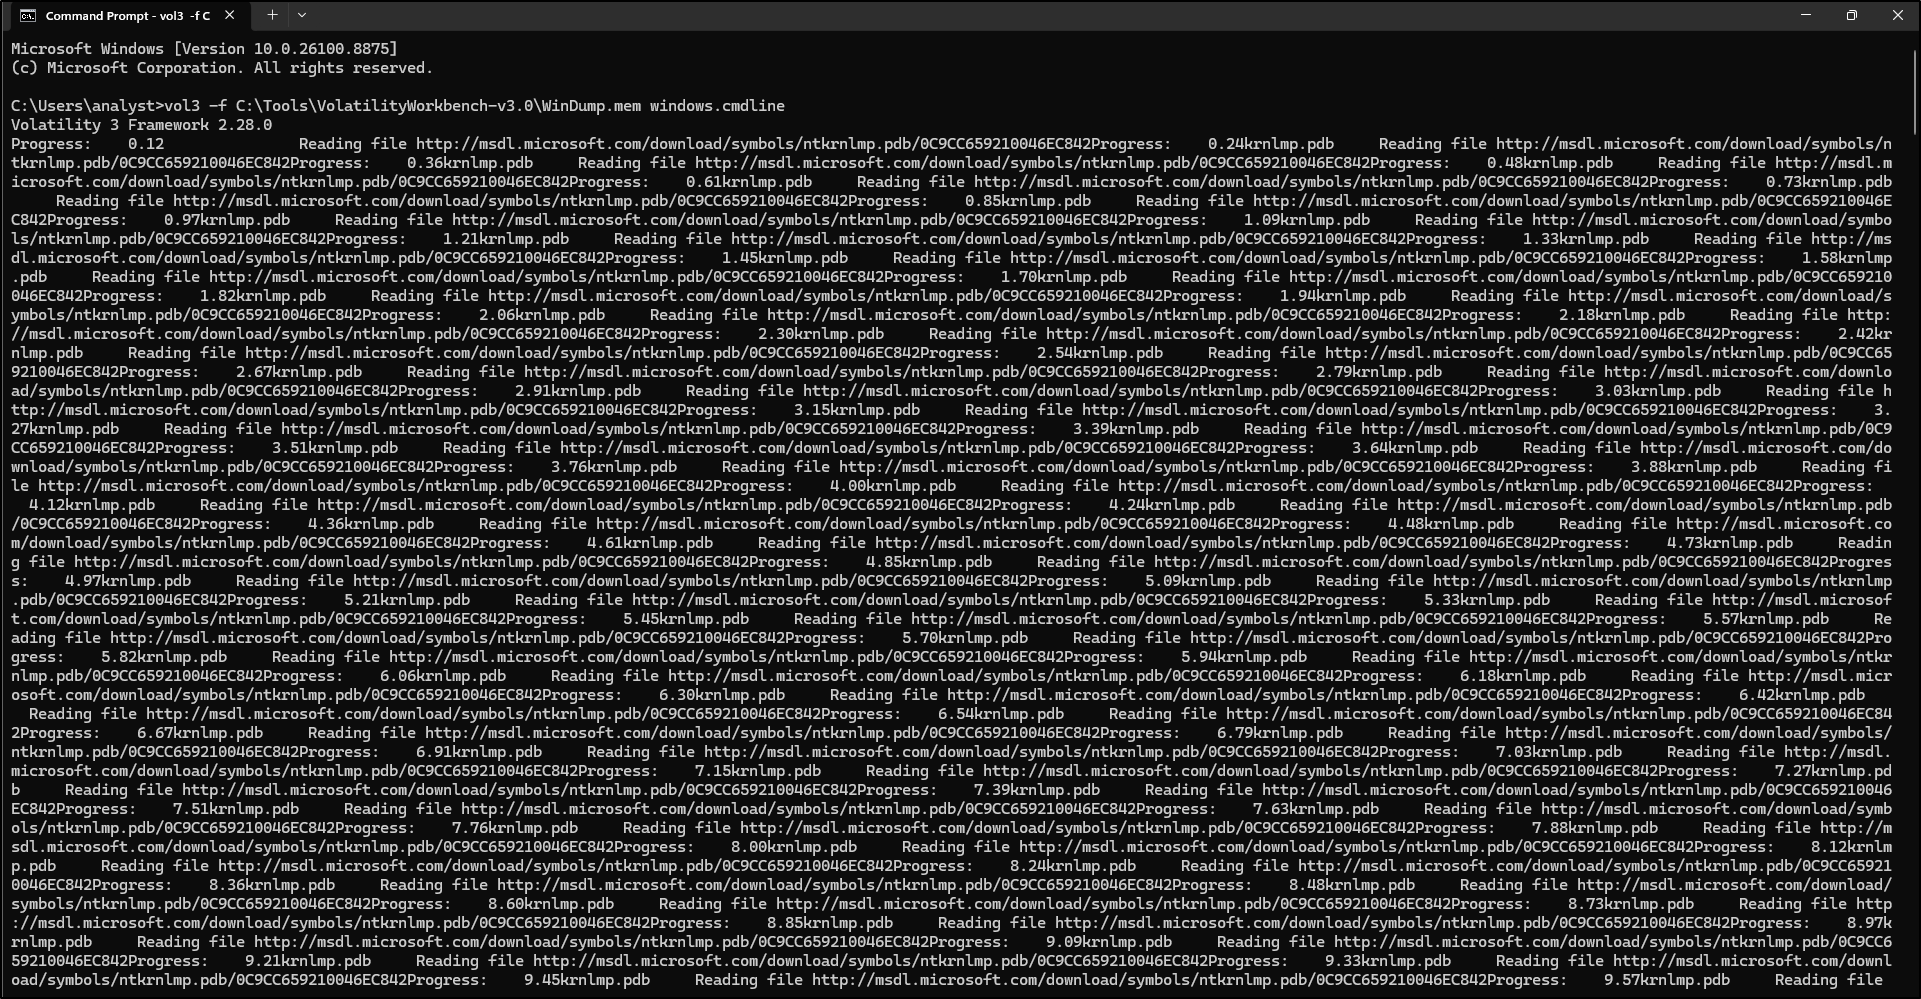
On the command prompt, run the following command to view a command line from the memory dump:
Note that Volatility 3 is first downloading Windows symbols automatically from the internet.
Testing Volatility Workbench v3.0
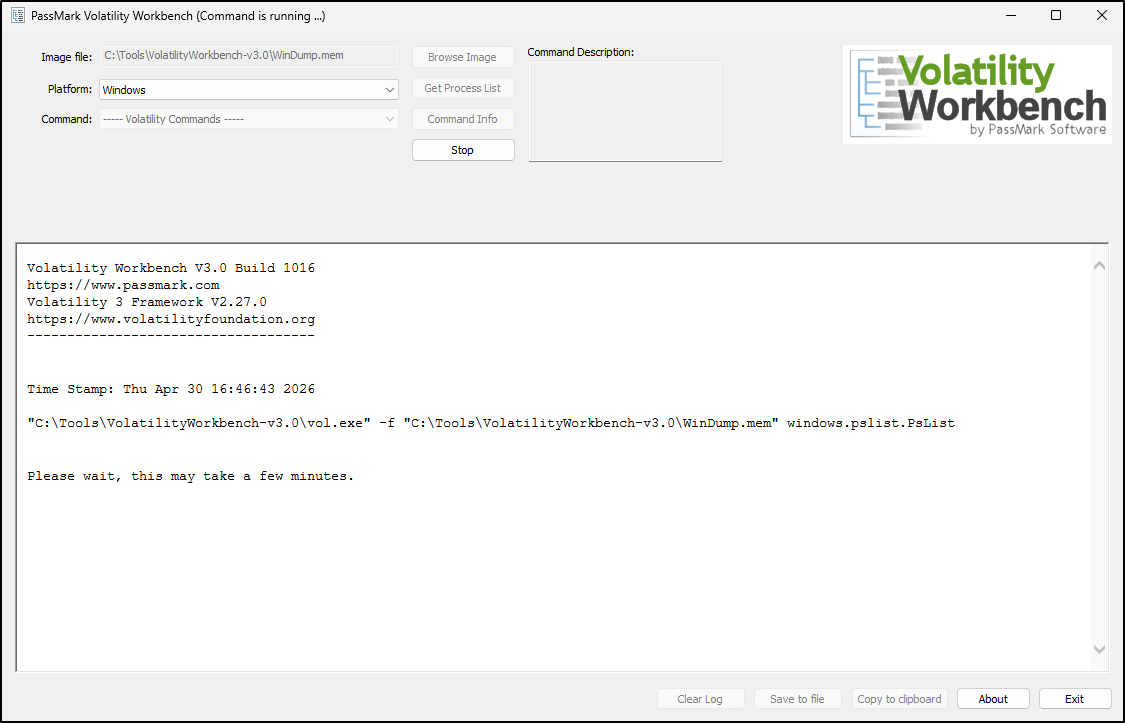
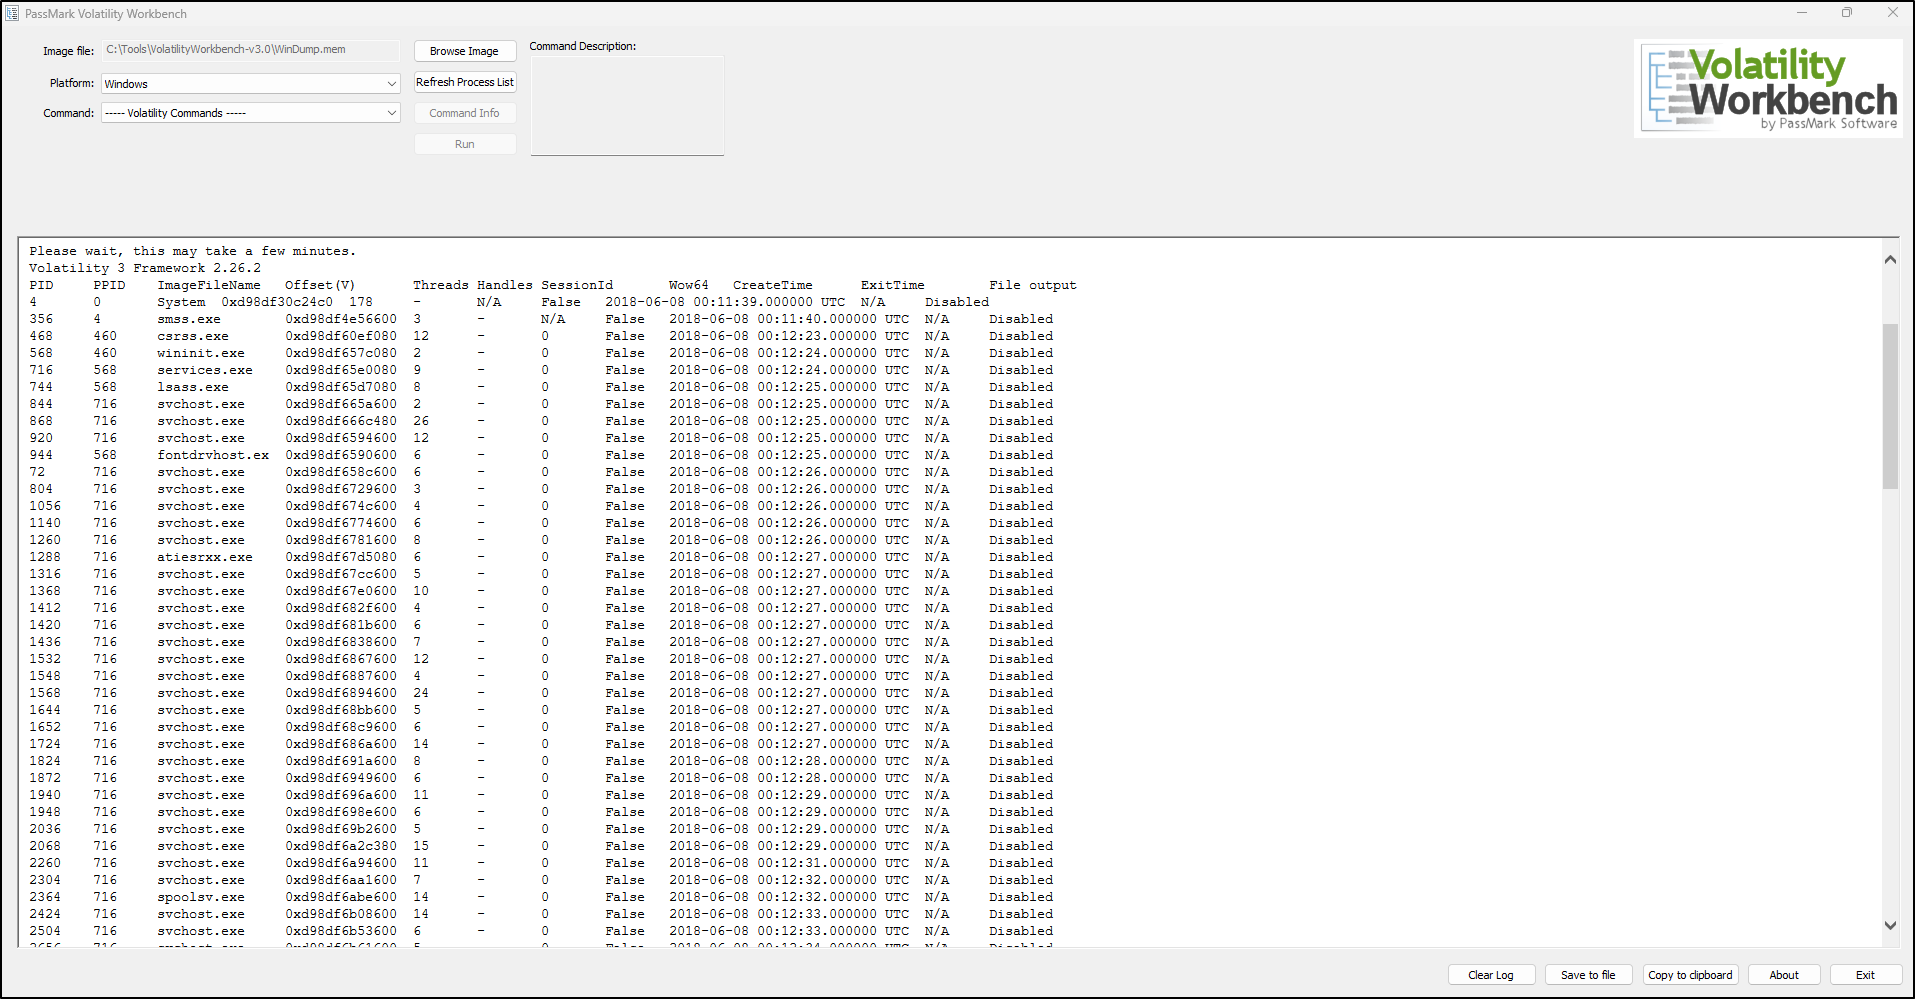
Double click VolatilityWorkbench. Click Browse Image and select WinDump.mem. For Platform, select Windows and click Get Process List. This process may take some time.
Read a process row
Use this guide beside the process-list screenshot above. Labels can differ by version; keep the values as displayed in your saved output.
- PID / process ID
- The number Windows gives this running copy of a program. Two copies can have the same name but different PIDs. Windows can reuse a PID after a process stops.
- PPID / parent process ID
- The number of the program recorded as starting this process. Look for that parent's row and compare its start time too. The parent may have stopped or may be missing from the available records.
- CreateTime / start time
- The recorded time this copy of the program started. Keep the date and time zone. Compare it with the capture window and other logs; do not assume the computer's clock was accurate.
- ExitTime / stopped time
- A recorded end time, when available. A blank or unavailable value does not establish how long the program ran or that it is still running now.
- ImageFileName / program name
- The name shown in the process record. It is not necessarily the full path. Read the command line for more context; a familiar name alone does not establish that activity was safe.
The official Windows tutorial shows the process-list columns and parent relationships. The process-list reference describes the plugin.
Optional practice / Workbench 3
Worked example: follow one process
Your task: your team needs an initial observation from a saved Windows memory image. Find one program, read its recorded command and save the supporting output. This establishes a starting point for further investigation; you do not need to find malware.
Use the working copy of WinDump.mem prepared above, or an instructor-approved Windows image. Use the actual filename, PIDs and times from that image. This example does not supply a second image or an expected process result.
- 1. Choose a program that is present
In Workbench 3, use Browse Image to open the working copy, select Windows, and choose Get Process List or Refresh Process List. Find a user program such as
explorer.exeif it is present; otherwise choose another program in your results. Record its name, PID, PPID and start/exit times, using the field guide above.Why: this identifies the specific running copy you will follow. Keep the image path and capture context with it.
- 2. Keep the starting output
Use Save to file and save the process output as
01-process-list.txtin a separate case output folder. Open the saved file to confirm it contains the process row and framework banner. Record the Workbench and framework versions. Keep warnings or errors with the run.Why: a teammate needs the source row, not just a PID copied into a note.
- 3. Read the same program's command
In Command, choose the entry containing
windows.cmdline. If a Process ID control is available, choose the PID you recorded; otherwise run the command and locate that PID in the returned rows. Select Run. Read the executable, paths and arguments without opening or running the named files.Why: the command shows what the program was asked to run. It does not show everything the code actually did. If the command is unavailable, record that gap; do not invent a value.
- 4. Save and explain the result
Use Save to file again, naming the output
02-command-line.txt. Workbench can keep several runs in its log, so check which runs the file contains. Find the chosen PID and command, or the relevant error. Save the selected command and PID with your note so another analyst can repeat the check.Why: the observation must stay connected to the image, settings and saved output.
Example note to adapt to your result
Finding: “In [working image], [program] has PID [number], PPID [number] and start time [date/time/zone]. The command-line output for that PID records [full command or unavailable value]. The supporting runs are saved in 01-process-list.txt and 02-command-line.txt using [Workbench and framework versions].”
Limit: “These records do not establish the program's complete behaviour or who started it. [Describe any missing command text, parent record, timing context or errors.]”
Next check: “Request process-start or script logs for the same host and time. Compare the start time, parent and path as well as the PID.”
Replace the brackets with actual observations. If the plugin failed, describe a failed check rather than reporting that no activity occurred.
Finished when: the two saved outputs can be opened, your note identifies the source rows or gaps, and it names one sensible next check. Continue to the Full Lab to retain the wider case context and evidence checklist.
The GUI controls and saving behaviour are described in the Workbench vendor guide. The command-line plugin reads recorded program arguments from memory.
Quick help / keep the error with the case
Troubleshooting
Choose the symptom below. Save the exact message, image path, tool version and command before changing anything. An error is a failed check to resolve or report; it is not a finding that the computer was clean.
The image cannot be found or opened
Confirm the download and extraction finished. Select the extracted memory image, such as WinDump.mem, rather than its ZIP archive. Use Browse Image to check the full path and that this account can read it. A .mem filename alone does not establish that the file is a supported image.
For the command line, -f selects the input file. Put paths containing spaces in quotes. If the file is found but the tool still cannot interpret it, check the reported memory layer, format and Windows-build support before treating it as a symbol problem.
“Unsatisfied requirement”, missing symbols or a memory-layer error
Symbols help Volatility understand the structures inside Windows memory. A message naming symbol_table_name points to an unmet symbol requirement; one naming layer_name points to an unmet memory-layer requirement. Several requirements may fail together, so retain the whole message.
Confirm Windows is selected and the installed framework supports the image. Workbench symbol packs stay as named ZIPs in its symbols folder. A separate Python installation has its own symbol locations and cache; copying packs beside Workbench does not configure that installation.
Windows symbols can often be retrieved automatically. The first run may need permitted internet access and time to build a cache. For an offline workstation, arrange matching symbols in advance. If the same image still fails, keep the error and test a known supported sample to help separate a setup problem from an image problem. Do not guess a Volatility 2 profile for a Volatility 3 command.
See the official symbol guide and Workbench symbol instructions.
vol -h shows a disk-volume message or “vol3 is not recognised”
Windows Command Prompt has a built-in command called vol that displays volume information. It can run instead of Volatility. vol3 is the optional alias created in the original walkthrough; it is not guaranteed to exist on another computer.
In Command Prompt, try the bundled executable by its full path. Adjust the path if you extracted Workbench elsewhere:
Look for the Volatility 3 Framework banner and plugin help. If you prefer the vol3 alias, check that its batch file points to your installed executable, add its actual directory to User Path, and open a new Command Prompt. The screenshot's analyst username and Python folder are examples.
Microsoft documents the separate Windows vol command.
The plugin name is unknown, ambiguous or rejects an option
Use the exact executable you intend to run with -h to see its plugins, then request help for the selected plugin. For the Workbench bundle in Command Prompt:
Check spelling and version. Volatility 3 uses plugin names such as windows.cmdline; the retained Volatility 2 examples use different syntax and --profile. A plugin may also be unavailable because a dependency failed to load; keep that diagnostic rather than changing the image to force a result.
In a full analysis command, global options such as -f go before the plugin name; the plugin's own options go after it. Follow the options listed by your installed version. The official Windows tutorial shows this command structure.
The PID, command line or time I expected is missing
Check that the image and PID are the ones you recorded. Clear any filter or Process ID selection to inspect the full result. Some records or command text may be unavailable because the needed memory was not captured, was paged out, or belonged to a program that stopped.
Write “unavailable in this output” and retain errors. Missing text is not proof there were no arguments; an absent row does not establish that the program never ran. Use the field guide, compare another supported view if appropriate, and request logs for the relevant host and time. The command-line plugin source documents unreadable-memory handling.